


Download Earnings Press Release Fourth Quarter 2016>>
Investor Conference Call on March 10, 2017 at 8:00 a.m. EST.
• Revenue in 2016 was $63.5 million; an increase of 48% versus prior year.
• Fourth quarter 2016 Revenue was $15.1 million; a 16% increase from a year ago and was its fifth consecutive quarter of year over year growth.
• Gross margin continued to improve, to 28% for fiscal 2016; up from 21% last year
• Full year Operating expenses in 2016 were $20.3 million; down $0.9 million from the comparable period last year.
• Current year Adjusted EBITDA was $1.4 million, with each quarter posting a positive result, following an Adjusted EBITDA loss in 2015 of $6.9 million
• Cash on hand increased by $4.3 million in Q4 2016, to $13.8 million.
Toronto, CANADA, March 9, 2017 – Baylin Technologies Inc. (TSX: BYL) (the “Company” or “Baylin”), a global provider of innovative antenna solutions for the networking, mobile and wireless infrastructure markets, today announced its financial results for the three and twelve months ended December 31, 2016. All figures are stated in United States dollars unless otherwise noted.
Key highlights for the twelve months ended December 31, 2016:
- Revenue grew to $63.5 million, up 48% from last year.
- Gross profit grew to $17.7 million, a 95% increase from fiscal 2015, and a 6.8 percentage point improvement in the gross margin. (See Non-GAAP Measures on page 2 of the MD&A)
- Positive Adjusted EBITDA, was $1.4 million, reversing an Adjusted EBITDA loss of $6.9 million a year ago. Certain non-recurring and one-time expenses (“non-recurring items”) were incurred in fiscal 2016 of $0.9 million. (See Non-GAAP Measures on page 2 of the MD&A).
- Though fiscal 2016 showed a net loss of $2.0 million, it was significantly improved from fiscal 2015 where the net loss was $14.7 million. Net loss, adjusted for the non-recurring items, was $1.1 million in fiscal 2016, whereas the net loss in fiscal 2015, adjusted for the non-recurring items, was $12.9 million. (See Non-GAAP Measures on page 2 of the MD&A)
- Liquidity improved by issuing common shares for gross proceeds of CAD$5.75 million, and selling land and building in Israel for $1.8 million. Cash on hand increased by $2.3 million, to $13.8 million, from the end of fiscal 2015. Net cash increased by $6.1 million over the same period.
- Commenced construction of a new product introduction line, intended to streamline the development-to-manufacturing process, hired additional engineering staff and external R&D resources to refresh product lines, and completed the transition of the head office to Toronto, Canada.
Key highlights for the three months ended December 31, 2016:
- Revenue and gross profit grew in the most recent quarter by 16% and 39%, respectively, from the same period in fiscal 2015. This was the fifth consecutive quarter of year-over-year growth.
- Adjusted EBITDA in Q4 2016 was positive $0.1 million despite $0.4 million in provisions related to a customer’s quality issue; an improvement upon last year which posted an Adjusted EBITDA loss of $1.5 million.
Randy Dewey, Vice Chairman, President and Chief Executive Officer commented,
“We view 2016 as having made significant strides in improving the financial performance of Baylin. The fourth quarter saw continued improvement in all key performance indicators, especially year over year Revenue growth in all three product lines, the fourth consecutive quarter of positive Adjusted EBITDA, and strengthened balance sheet. The recent equity offering, which was over-subscribed, gives us the resources for a more aggressive entry into the Base Station Antenna (“BSA”) market.”
Mr. Dewey added: “On behalf of the Board of Directors and the management team, I would like to acknowledge the patience and support of our shareholders as we went through the much needed changes over the past 18 months. That said, we will continue our efforts on increasing profitability and cash flow. Entering 2017, we are confident the Company is headed in the right direction in controlling operating expenses, improving margins, increasing liquidity, as well as building a stronger sales culture to achieve growth and diversifying our customer base.”
Selected Financial Information (In thousands of United States dollars except per share amounts)
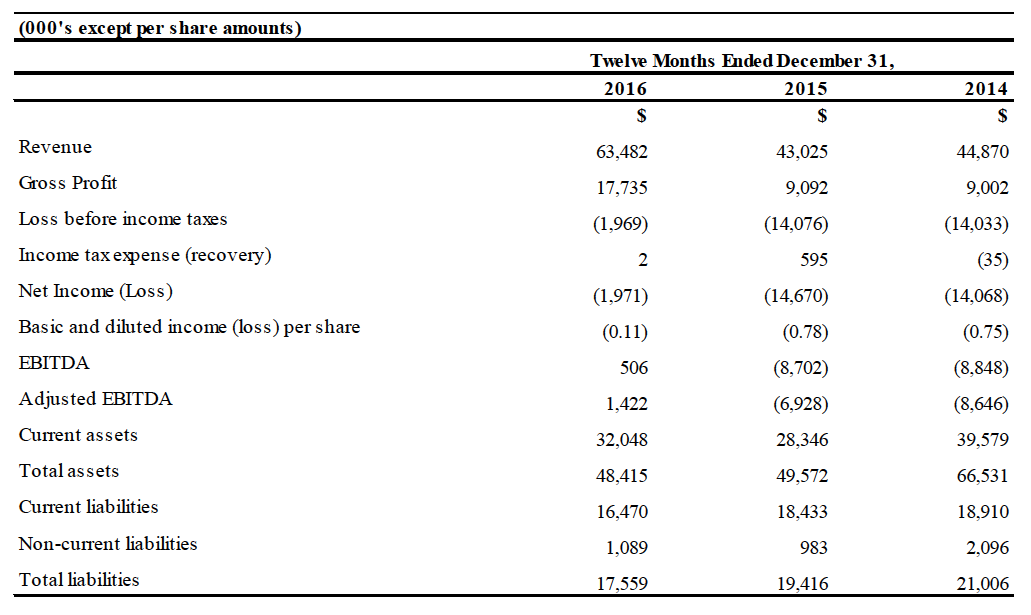
Financial Summary
Results of Operations for the three months ended December 31, 2016 and 2015:
Revenue and Gross Profit
a) Factors Affecting Revenue and Gross Profit
Revenue
Revenue is derived from the sale of our antenna products. Financial results are reported as one reportable segment. The Company manufactures and sells a variety of antenna products such as antennas for mobile handsets and smartphones, networking and telemetry devices, land mobile radios, telematics and wireless infrastructure antennas. Revenue is impacted by the timing of our customer’s product launches, their project deployment plans, and network expansion investment levels by carriers and independent providers.
Gross profit
Our gross profit is impacted by selling prices and sales volumes, product mix and the variable costs of goods sold (being direct materials and direct labour). The Company also commenced lean manufacturing processes in order to optimize and reduce its fixed manufacturing costs going forward.
b) Fiscal 2016 compared to Fiscal 2015
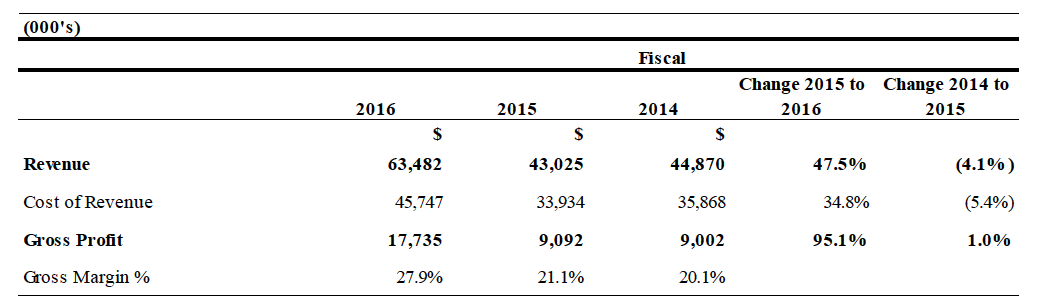
Revenue was $63.5 million in fiscal 2016, an increase of 47.5% when compared to fiscal 2015’s level of $43.0 million. This growth was led by the mobile product line, which more than doubled the level posted in fiscal 2105, followed by Wireless Infrastructure products which grew by 23.5%, The growth in the Mobile product line was as a result of the volumes to our major customer rebounding in fiscal 2016. Networking declined by 4.1% year-over-year due to the timing of customer orders delayed to 2017.
Gross Profit was $17.7 million in fiscal 2016, or 27.9% of Revenue; comparing favourably with fiscal 2015, where it was $9.1 million (21.1% of Revenue). The improvement was due to (i) higher production volumes associated with higher fiscal 2016 revenue, and (ii) the new Vietnam plant ramping up.
R&D Expenses
a) Factors Affecting R&D Expenses
R&D expenses consist primarily of salaries, patent fees, product development costs and other related engineering expenses. Our technological design centers are located in Israel, South Korea and the United States. As such, we often incur significant expenditures in the development of a new product without any assurance that our customers’ system designers will ultimately select our product for use in their applications. We are often required to anticipate which product designs will generate demand in advance of our customers expressly indicating a need for that particular design. Even if our customers’ system designers ultimately select our products, a substantial period of time will elapse before we generate revenue relative to the possibly significant expenses we have initially incurred.
b) Fiscal 2016 compared to Fiscal 2015
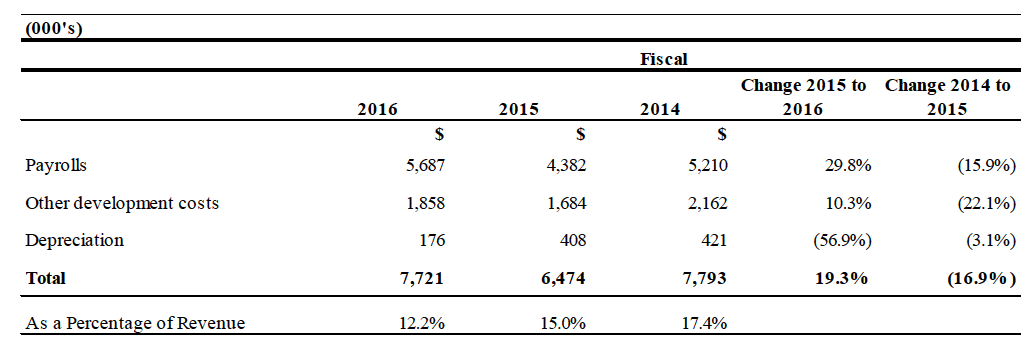
R&D expense in fiscal 2016 was $7.7 million, or 12.2% of Revenue; a dollar increase from fiscal 2015’s amount of $6.5 million (15.0% of Revenue). The increase was attributable to increased headcount hired to develop products to expand our product lines.
Sales and Marketing
a) Factors Affecting Sales and Marketing Expenses
Sales and marketing expenses consist primarily of salaries, advertising, trade shows, travel costs and other promotional activities. These costs can be material when entering new markets such as the infrastructure market and acquiring new customers, requiring meaningful investments to win new business.
b) Fiscal 2016 compared to Fiscal 2015
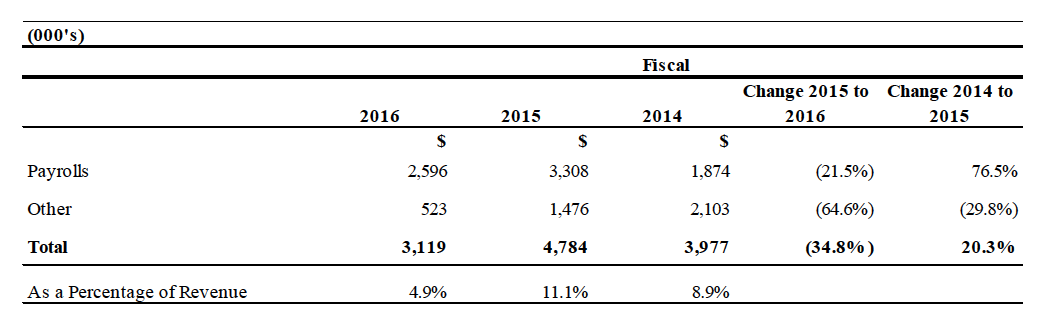
Sales and marketing expenses in fiscal 2016 were $3.1 million (4.9% of Revenue), whereas in fiscal 2015 these expenses were $4.8 million (11.1% of Revenue). The decrease in the absolute dollar amount of these expenses was mainly in cost control in other expenses (such as trade shows and travel), and to a lesser extent in payroll costs due to streamlining our senior sales management.
G&A
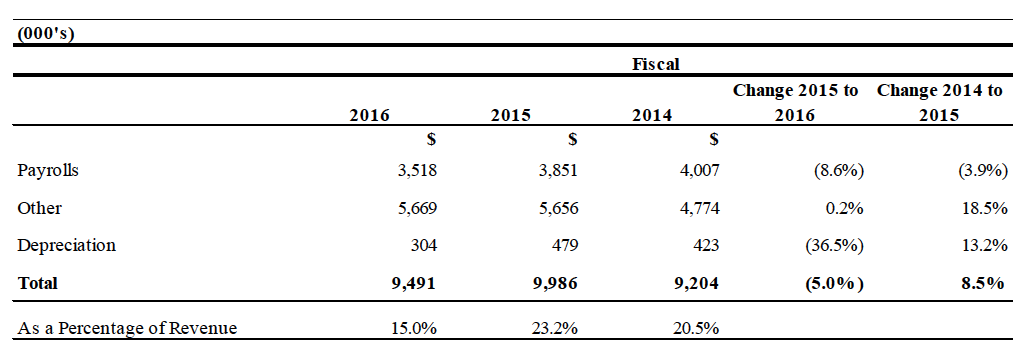
a) Factors Affecting G&A Expenses
G&A expenses consist of costs relating to human resources, legal and finance functions, professional fees, insurance and other corporate expenses.
b) Fiscal 2016 compared to Fiscal 2015
G&A expenses in fiscal 2016 were $9.5 million (15.0% of Revenue), whereas in fiscal 2015 these expenses were $10.0 million (23.2% of Revenue). The decrease in absolute dollar terms was due to ongoing expense control and the move of the head office.
EBITDA and Adjusted EBITDA
EBITDA and Adjusted EBITDA are non-IFRS measures that we use to assess our operating performance. EBITDA and Adjusted EBITDA are reconciled as follows:
Reconciliation to Operating Loss
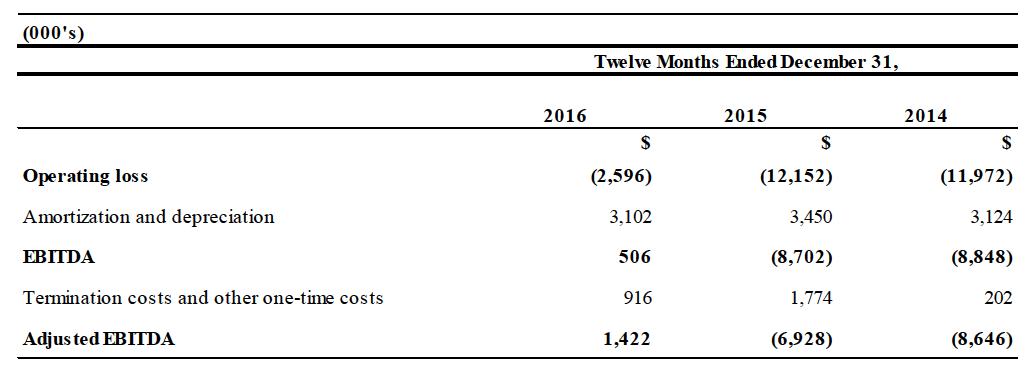
a) Factors Affecting Operating loss, EBITDA and Adjusted EBITDA
Operating loss, EBITDA and Adjusted EBITDA are highly impacted by revenue volumes, the mix of product sales and operating expense overheads.
b) Fiscal 2016 compared to Fiscal 2015
Operating loss in fiscal 2016 was $2.6 million, a significant improvement over fiscal 2015’s operating loss of $12.2 million. Adjusted EBITDA in fiscal 2016 was $1.4 million (2.3% of Revenue), whereas in fiscal 2015 Adjusted EBITDA was a loss of $6.9 million. The improvements in operating loss, EBITDA and Adjusted EBITDA were due primarily to the higher revenue volumes and operating cost control. The non-recurring items in fiscal 2016 amounted to $0.9 million, and were comprised primarily of severance, and an inventory write down related to our major customer’s quality issue.
Net Loss for the Period
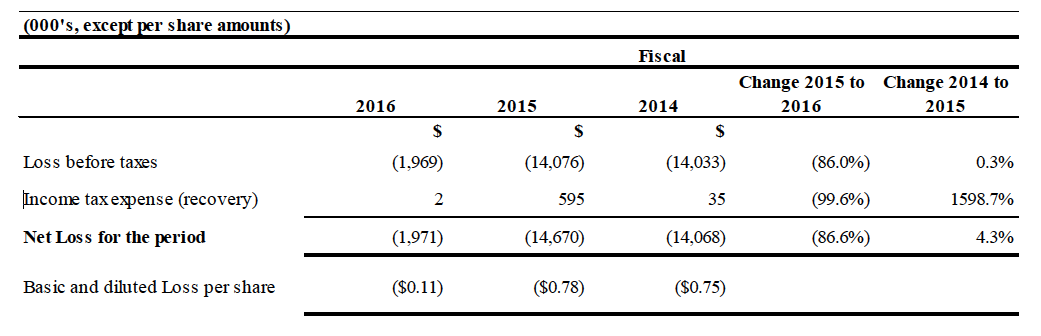
a) Factors Affecting Net Income or Loss
Net loss is influenced by the above noted factors for Operating loss and EBITDA.
b) Fiscal 2016 compared to Fiscal 2015
Net loss in fiscal 2016 was $2.0 million; a substantial improvement over fiscal 2015 the net loss was $14.7 million (23.2% of Revenue). On a loss per share basis, fiscal 2016 had a loss of $0.11 per share, whereas in fiscal 2015 this amount was $0.78 per share.
OUTLOOK
Cost management, manufacturing efficiencies and product line rationalization were a key focus in fiscal 2016 and will continue into fiscal 2017, though management intends to make prudent R&D investments to facilitate continued growth. As noted in the short form prospectus filed in December, 2016, CAD$3.0 million of the proceeds from the equity offering will be used to finance incremental R&D in fiscal 2017 in order to accelerate entry into the Base Station Antenna (“BSA”) market.
While the board of directors and management are encouraged by the full year positive EBITDA result, the over-arching focus in fiscal 2017 has not changed; that is continuing the momentum created in fiscal 2016 while prudently managing our liquidity. Exploring new opportunities in the Mobile market, continuing to diversify and expand the Networking customer portfolio and further expanding the Wireless Infrastructure product portfolio, especially into the BSA market, will be our primary focus. Also, management will explore opportunities to increase the scale of our business through a strategic, accretive acquisition or acquisitions.
Conference Call
Baylin will hold a conference call to discuss its 2016 three and twelve month financial results on March 10, 2017, at 8:00 a.m. (ET). The call will be hosted by Randy Dewey, Vice-Chairman, President and Chief Executive Officer, and Clifford Gary, VP Finance and Corporate Controller. All interested parties are invited to participate.
DATE: March 10, 2017
TIME: 8 a.m.
DIAL IN NUMBER: 647-427-7450
888-231-8191
CONFERENCE ID#: 54242545
WEBCAST DETAILS: Webcast URL (EN):
http://event.on24.com/r.htm?e=1349662&s=1&k=CFBFF806EBF92CB9EF44600A89243BCD
FORWARD-LOOKING STATEMENTS
Certain statements in this Press Release constitute “forward-looking” statements that involve known and unknown risks, uncertainties and other factors which may cause the actual results, performance, objectives or achievements of the Company, or industry results, to be materially different from any future results, performance, objectives or achievements expressed or implied by such forward looking statements. The forward-looking statements in this Press Release include, but are not limited to, statements regarding the Company’s expected product pipeline, plans to expand the Company’s business into new markets, the Company’s ability to achieve organizational efficiencies, and other statements regarding the Company’s plans and expectations in 2016. These statements reflect our current views regarding future events and operating performance and are based on information currently available to us, and speak only as of the date of this Press Release. These forward-looking statements involve a number of risks, uncertainties and assumptions and should not be read as guarantees of future performance or results, and will not necessarily be accurate indications of whether or not such performance or results will be achieved. Those assumptions and risks include, but are not limited to, the Company’s ability to successfully allocate capital as needed and to develop new products, as well as the fact that our results of operations and business outlook are subject to significant risk, volatility and uncertainty. Many factors could cause our actual results, performance or achievements to be materially different from any future results, performance or achievements that may be expressed or implied by such forward-looking statements, including the factors identified in the “Risk Factors” section of the Company’s Annual Information Form dated March 9, 2016. Should one or more of these risks or uncertainties materialize, or should assumptions underlying the forward-looking statements prove incorrect, actual results may vary materially from those described in this Press Release as intended, planned, anticipated, believed, estimated or expected. Unless required by applicable securities law, we do not intend and do not assume any obligation to update these forward-looking statements.
(1) NON-GAAP MEASURES
This press release includes a number of measures that are not prescribed by Canadian generally accepted accounting principles (“GAAP”) and as such may not be comparable to similar measures presented by other companies. We believe these measures are commonly employed to measure performance in our industry and are used by analysts, investors, lenders and interested parties to evaluate financial performance and our ability to incur and service debt to support our business activities. The measures we use are specifically defined (See Non-GAAP Measures on page 2 of the MD&A).
While we believe that non-GAAP measures are helpful supplemental information, they should not be considered in isolation as an alternative to net income, cash flows generated by operating, investing or financing activities, or other financial statement data presented in accordance with GAAP.
About Baylin
Baylin (TSX: BYL) is a leading global technology company with over 38 years of experience in designing, producing and supplying innovative antennas for the mobile, Networking and wireless infrastructure industries. We strive to meet our customers’ needs by being their trusted partner from initial design to production with an extensive portfolio of custom engineered solutions and leading edge off-the-shelf antenna products.
SOURCE: Baylin Technologies Inc.
For further information please contact Investor relations:
investor.relations@baylintech.com


