


Baylin Technologies Inc.
Management’s Discussion and Analysis of Financial Condition and Results of Operations For the Three and Twelve Months Ended December 31, 2025
This management’s discussion and analysis (“MD&A”) of financial condition and results of operations of Baylin Technologies Inc. (“Baylin”, the “Company”, “we” or “us”) was prepared by the Company’s management. This MD&A should be read in conjunction with the audited consolidated financial statements of Baylin and related notes thereto for the years ended December 31, 2025 (“fiscal 2025”) and December 31, 2024 (“fiscal 2024”) (collectively, the “Financial Statements”). The Financial Statements have been prepared using accounting policies consistent with International Financial Reporting Standards (“IFRS”) as issued by the International Accounting Standards Board (“IASB”). In preparing this MD&A, management has taken into account information available to it up to March 25, 2026, unless otherwise stated.
Additional information relating to the Company, including the most recent Annual Information Form, may be found under the Company’s profile on SEDAR+ at www.sedarplus.ca. Unless otherwise stated, all amounts shown in this MD&A are in Canadian dollars.
This MD&A contains commentary by the Company’s management regarding the Company’s strategy, operating results, financial position and outlook. Management is responsible for the accuracy, integrity, and objectivity of this MD&A. Accordingly, management develops, maintains and supports necessary systems and controls to provide reasonable assurance as to the accuracy of the comments contained herein.
On July 8, 2024, the Company entered into an agreement to sell its Mobile and Network (“M&N”) business line, comprised of Galtronics Korea Co., Ltd. (“GTK”) and Galtronics Vietnam Company Limited (“GTV”). The Company completed the sale of GTK on July 30, 2024 and, following receipt of Vietnamese regulatory approvals, completed the sale of GTV on December 27, 2024. As a result, for accounting purposes, the M&N business line is being reported as “held for sale” or “discontinued operations”. Unless otherwise noted in this MD&A, the financial and other disclosures reflect the continuing operations of the Company and exclude the M&N business line.
FORWARD-LOOKING INFORMATION AND STATEMENTS
This MD&A includes forward-looking information and forward-looking statements (together, “forward-looking statements”) within the meaning of applicable securities laws. Forward-looking statements are not statements of historical fact. Rather, they are disclosure regarding conditions, developments, events or financial performance that we expect or anticipate may or will occur in the future, including, among other things, information or statements concerning our objectives and strategies to achieve those objectives, statements with respect to management’s beliefs, estimates, intentions and plans, and statements concerning anticipated future circumstances, events, expectations, operations, performance or results. Forward-looking statements can be identified generally by the use of forward looking terminology, such as “anticipate”, “believe”, “could”, “estimate”, “expect”, “forecast”, “indicate”, “intend”, “likely”, “may”, “outlook”, “plan”, “potential”, “project”, “seek”, “should”, “target”, “trend”, “will” or “would” or the negative or other variations of these words or other comparable words or phrases, which is intended to identify forward-looking statements, although not all forward-looking statements contain these words.
The forward-looking statements in this MD&A include statements regarding the outlook for our business, our financial condition and results of operations, as well as available liquidity. Forward-looking statements are based on various assumptions and estimates made by us in light of the experience and perception of historical trends, current conditions, expected future developments, including projected growth or decline in sales of radio frequency products, including wireless antennas, antenna system equipment and satellite communications products, and the provision of supporting services, and other factors we believe are appropriate and reasonable in the circumstances, but there can be no assurance that such assumptions and estimates will prove to be correct.
Many factors could cause our actual results, level of activity, performance or achievements or future events or developments to differ materially from those expressed or implied by the forward-looking statements, including the risk factors discussed in the Company’s most recent Annual Information Form, which is available under the Company’s profile on SEDAR+ at www.sedarplus.ca. All the forward-looking statements in this MD&A are qualified by these cautionary statements and other cautionary statements or factors in this MD&A. There can be no assurance that the actual results or developments will be realized or, even if substantially realized, will have the expected consequences to, or effects on, the Company. Unless required by applicable law, the Company does not intend and does not assume any obligation to update any forward-looking statements.
NON-IFRS MEASURES
This MD&A includes a number of financial measures that are not recognized under IFRS, do not have any standardized meaning under IFRS and as such may not be comparable to similar measures presented by other companies. Management believes that these non-IFRS measures provide useful information to analysts, investors and other interested parties regarding the Company’s financial condition and results of operation as they provide additional key metrics of the Company’s performance. The measures we use are specifically defined where they are first used.
While management believes that non-IFRS measures provide useful supplemental information, they are not intended to represent, and should not be considered as alternatives to, net income (loss), cash flows generated by operating, investing or financing activities, or other financial statement data presented in accordance with IFRS.
Management also uses non-IFRS financial and other measures to exclude the impact of certain expenses and non-cash items that management does not believe reflect the Company’s underlying operating performance. It also uses these measures to measure our financial and operating performance for business planning purposes and as a component in the determination of incentive compensation for salaried employees. We may change these measures from time to time if we believe doing so would result in a more effective analysis of our underlying operating performance.
The non-IFRS measures presented in this MD&A are as follows:
-
-
- “Net debt”, which refers to total bank indebtedness less cash and cash equivalents;
- “Working capital”, which refers to current assets less accounts payable and accrued liabilities;
- “Non-cash working capital”, which refers to working capital less cash and cash equivalents;
- “Cash conversion cycle”, which is the amount of time it takes for the Company to convert its investment in non-cash working capital into cash in the most recently completed quarter, calculated as follows:
- days sales outstanding, which is the number of days, on average, it takes to turn trade receivables into cash, plus:
- days inventory outstanding, which is the number of days, on average, to convert inventory into finished goods and ultimately into sales, less:
- days payables outstanding, which is the number of days, on average, to repay trade payables;
- “Gross margin”, which refers to gross profit divided by revenue;
- “EBITDA”, which refers to net income (loss) plus tax expense (recovery), interest and other finance expense (income), investment income, fair value adjustments, depreciation and amortization;
- “Adjusted EBITDA”, which refers to EBITDA adjusted for the impact of certain items, including asset impairment charges, expenses from mergers and acquisitions, costs of reorganization of a business, gain or loss on the sale of a business including related expenses, legal costs arising from significant non-operating activities, severance and executive recruitment costs, and share-based compensation.
- “Backlog”, which refers to the value of unfulfilled purchase orders placed by customers.
Management believes that backlog provides useful information to analysts and investors as an indicator of anticipated revenue to be recognized upon fulfillment of the related purchase orders. Backlog may be subject to change as a result of project accelerations, cancellations or delays due to various factors, any of which could cause revenue to be realized in periods and at levels different from originally anticipated. Additionally, the Company’s method of calculating backlog may be different from methods used by other companies and, accordingly, may not be comparable to similar measures used by other companies.
-
The IFRS measurement most directly comparable to both EBITDA and Adjusted EBITDA is operating income (loss).
OVERVIEW
Background and Description of Operations
Baylin is a diversified global wireless technology company. The Company focuses on the research, design, development, manufacture and sale of passive and active radio frequency (“RF”) and satellite communications products, and the provision of supporting services. The Company’s products are marketed and sold under the brand names “Galtronics” and “Advantech Wireless”. The Company’s operations are conducted through subsidiaries.
Galtronics
The Galtronics line of business, established in 1978, designs and manufactures innovative wireless antenna solutions for customers’ embedded and infrastructure enabled products.
As a result of the Company’s sale of the M&N business line, the Galtronics line of business is comprised of two business lines: (a) Embedded Antenna; and (b) Wireless Infrastructure.
-
-
-
- The Embedded Antenna business line works with original equipment manufacturer (“OEM”) customers to custom engineer and produce antennas for home networking devices (such as Wi-Fi routers, gateways and set-top boxes), 5G products and land mobile radio products. Embedded Antenna volumes are produced at the Company’s facility in China and third-party facilities in Vietnam.
- The Wireless Infrastructure business line works with network carrier customers and other businesses to design and produce small cell and macro system antennas, stadium and venue antennas, distributed antenna systems (“DAS”), as well as multibeam antennas that support wireless coverage and mobile data capacity requirements. Wireless Infrastructure volumes are produced at the Company’s facility in China and third-party facilities in Vietnam.
-
-
Satcom
The Satcom line of business designs and manufactures customizable satellite RF products for highly specialized wireless communications markets and for commercial, critical infrastructure, government and military clients. These include:
-
-
- Active Components: L, S, C, X, Ku and Ka bands, with frequencies that range from 2.0 to 31.0 GHz and within power spectrum of 5 to 12,000 watts; and,
- Passive Components: 500 MHz to 80 GHz passive RF components, which include filters, diplexers and combiners / dividers.
-
Products are designed and produced for customers in the following verticals: (i) broadcast; (ii) maritime; (iii) government and military; (iv) homeland security; (v) direct-to-home satellite; (vi) oil and gas; and, (vii) wireless communications. Satcom’s products are manufactured at the company’s facilities in Canada and the United States.
SELECTED FINANCIAL INFORMATION
The table below discloses selected financial information for the periods indicated.
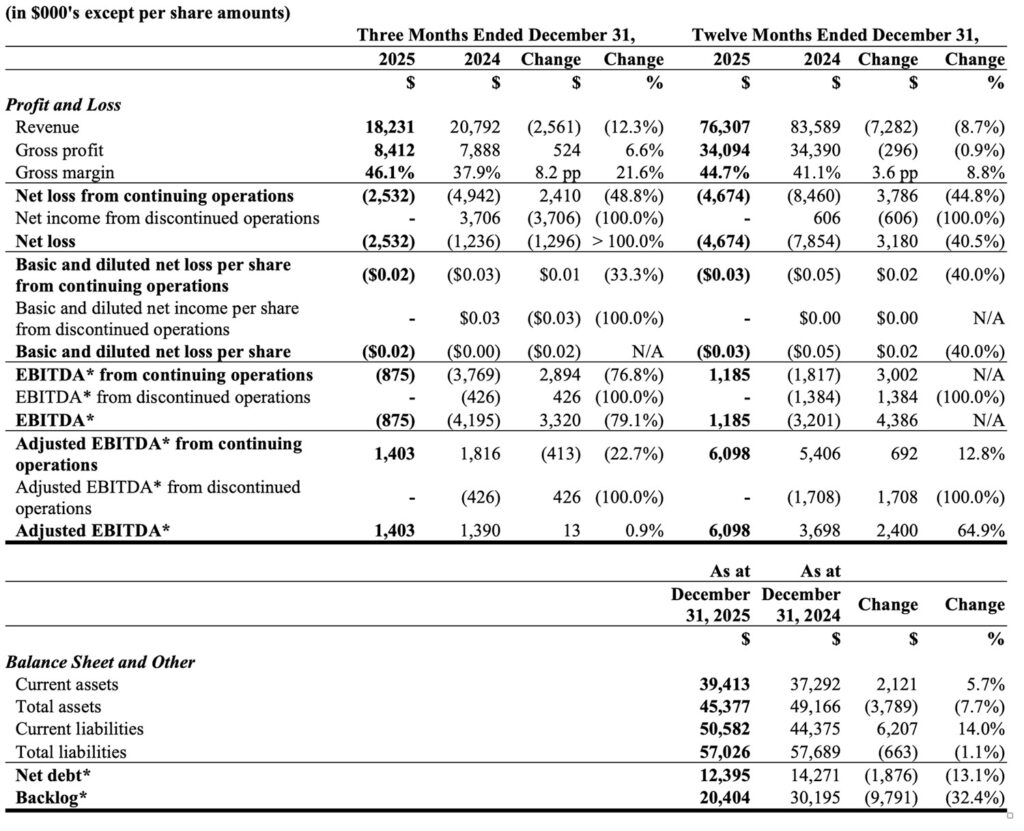
* EBITDA, Adjusted EBITDA, Net debt and Backlog are non-IFRS measures that management uses to assess the Company’s operating performance, liquidity and business dynamics (see “Non-IFRS Measures” on page 3 of this MD&A).
FISCAL YEAR SUMMARY
-
-
- Revenue of $76.3 million compared to $83.6 million in fiscal 2024, due primarily to lower demand in the Embedded Antenna and Satcom business lines in fiscal 2025, partially offset by strong sales volume increase in the Wireless Infrastructure business line compared to the prior fiscal year.
- Gross margin (see “Non-IFRS Measures” on page 3 of this MD&A) of 44.7% compared to 41.1% in fiscal 2024. The higher gross margin in fiscal 2025 was mainly due to improved product mix from stronger sales of multibeam, small cell and other innovative antennas from the Wireless Infrastructure business line, as well as improved gross margin from the Embedded Antenna business line.
- Gross profit of $34.1 million compared to $34.4 million in fiscal 2024, primarily due to the decrease in revenue in the Embedded Antenna and Satcom business lines discussed above, while largely offset by the increase in revenue and favourable gross margin in the Wireless Infrastructure business line in fiscal 2025.
- Adjusted EBITDA (see “Non-IFRS Measures” on page 3 of this MD&A) of $6.1 million in fiscal 2025, an increase of $0.7 million or 12.8% compared to fiscal 2024, primarily due to higher gross profit generated by the Wireless Infrastructure business line in fiscal 2025.
- Net loss of $4.7 million compared to $8.5 million in fiscal 2024, due mainly to lower operating expenses and a favourable adjustment on the fair market value of the Company’s convertible debentures in fiscal 2025. On a per share basis, a net loss of $0.03 per share in fiscal 2025 compared to a net loss of $0.05 per share in fiscal 2024.
- Net debt (see “Non-IFRS Measures” on page 3 of this MD&A) of $12.4 million at December 31, 2025, a reduction of $1.9 million from December 31, 2024, mainly attributable to the Company’s efficient management of cash and working capital during fiscal 2025.
- Backlog (see “Non-IFRS Measures” on page 3 of this MD&A) of $20.4 million at December 31, 2025 compared to $30.2 million at December 31, 2024. The change was primarily due to a slowdown in order intake in the Satcom business line during fiscal 2025. Backlog was $22.2 million at February 28, 2026.
-
FOURTH QUARTER SUMMARY
-
-
- Revenue of $18.2 million compared to $20.8 million in the fourth quarter of 2024. The decrease in revenue in the fourth quarter of 2025 was mainly due to lower sales volume in the Embedded Antenna and Satcom business lines as discussed above.
- Gross margin of 46.1% compared to 37.9% in the fourth quarter of 2024. The higher gross margin in the fourth quarter of 2025 was mainly attributable to improved product mix.
- Gross profit of $8.4 million in the fourth quarter of 2025 was an increase of $0.5 million or 6.6% compared to the fourth quarter of 2024, primarily due to the Wireless Infrastructure business line which generated stronger revenue and favourable gross margin in the fourth quarter of 2025.
- Adjusted EBITDA of $1.4 million compared to $1.8 million in the fourth quarter of 2024. The Adjusted EBITDA in the fourth quarter of 2024 included a reclassification of $2.0 million from cash based to non-cash based share compensation.
- Net loss of $2.5 million compared to $4.9 million in the fourth quarter of 2024. The net loss in the fourth quarter of 2024 included an impairment charge in the amount of $2.6 million for Satcom business line. On a per share basis, a net loss of $0.02 per share in the fourth quarter of 2025 compared to a net loss of $0.03 per share in the fourth quarter of 2024.
-
RECENT DEVELOPMENTS
Acquisition of Kaelus AB
On December 1, 2025, Baylin announced that it had entered into a share purchase agreement with the shareholders of Kaelus AB (“Kaelus”) to acquire 100% of the shares of Kaelus for a purchase price of approximately $42 million (subject to adjustment and net of excess cash). The purchase price will be satisfied through a combination of common shares and cash, comprising approximately 52.2 million common shares and $26 million in cash.
The cash portion of the purchase price payable at closing will be funded in part from the proceeds of an offering of 41.25 million subscription receipts at a price of $0.25 or $10.3 million, which was completed in December 2025. The proceeds of the offering are being held in escrow pending completion of the acquisition and the satisfaction of other required conditions (the “Escrow Release Conditions”). Assuming satisfaction of the Escrow Release Conditions, one common share will be automatically issued in exchange for each subscription receipt, and the net proceeds will be released to the Company. If the Escrow Release Conditions are not satisfied, the proceeds will be returned to investors plus interest.
At the time of announcement of the acquisition, the Company entered into a non-binding term sheet with a Canadian private lender (the “Lender”) to provide a senior secured term loan (the “Loan”), which would be guaranteed by certain of the Company’s subsidiaries. The Loan would be used to fund part of the cash portion of the purchase price of the acquisition, repay in full the Company’s revolving credit facility with its existing principal lender, and for general corporate purposes. The Company and the Lender are continuing to negotiate the terms of the Loan. Subject to agreement on those terms, the Company is targeting completion of the acquisition early in the second quarter of 2026. However, there can be no assurance the parties will be able to reach agreement on the terms of the Loan. In that case, the Company would explore alternative options for the financing required to complete the acquisition, failing which the acquisition may not be completed.
The Company has received foreign investment approval in Finland for the acquisition and conditional approval from the TSX for the issuance of common shares related to the acquisition and the subscription receipts offering, subject to receipt of shareholder approval. The Company intends to rely on section 604(d) of the TSX’s Company Manual under which, in certain circumstances, the TSX may permit a listed issuer to provide the TSX with written evidence that holders of more than 50% of the voting securities of the issuer, and who are familiar with the proposed transaction, are in favour of the transaction. The Company intends to seek shareholder approval in reliance on this provision.
OUTLOOK
Corporate
The Company demonstrated strong operational resilience in fiscal 2025, successfully navigating revenue contraction through disciplined cost management and effective portfolio optimization. While the 8.7% decrease in revenue reflected a challenging market environment particularly in the Satcom business line, both the 12.8% increase in Adjusted EBITDA and the marginal 0.9% drop in gross profit reflected the effect of successful optimization of product mix, continued focus on gross margins and enhanced operational efficiency. Overall, the Company’s financial results in fiscal 2025 highlighted our consistent focus on prioritizing bottom-line stability despite top-line fluctuations, with the aim of building a leaner, more efficient and more cash-generative business model better positioned for long-term value creation.
However, the macroeconomic environment remains a challenge for the Company, with continuing uncertainty over the impact of US tariffs and retaliatory tariffs from countries subject to US tariffs, changes in customer purchasing behaviour driven by uncertainty over tariffs, as well as the overall level of inflation and interest rates. In addition, tariffs could also affect foreign exchange rates and disrupt supply chains on which the Company relies in producing its products. Despite these challenges and uncertainties, we remain committed to our core principles: clear market driven strategies, containing costs, prioritizing research and development, and focusing on both revenue growth and margin improvement. Based on our current assessment of each business unit, we expect the Company’s performance in fiscal 2026 will be mainly driven by: (i) sales volume increases from new and existing customers in the Embedded Antenna business line; (ii) continuing strength in sales and gross margin in the Wireless Infrastructure business line; and, (iii) lower sales but leaner operations and improved cost structure in the Satcom business line.
Wireless Infrastructure Business Line
In 2026, Wireless Infrastructure expects continuing strong sales of its multibeam and innovative small cell antennas as well as stadium deployments throughout the year. We are continuing to leverage the competitive advantages that our multibeam antennas provide in order to open up additional global opportunities and drive further sales with wireless carriers and third-party operators who operate wireless mobile networks for their customers. We are continuing to expand market penetration, including the domestic market in Canada, where we believe there are significant opportunities for us to penetrate the major Canadian carriers. The Wireless Infrastructure business line is also in the process of commercializing a new derivative of its patented multibeam antenna and has several carriers asking for a trial. Based on our current assessment for 2026, we anticipate Wireless Infrastructure’s performance in revenue, gross profit and Adjusted EBITDA will be comparable with 2025, which was a very strong year.
Embedded Antenna Business Line
Embedded Antenna experienced softer revenue in fiscal 2025 compared to fiscal 2024. This was due largely to unforeseen changes in customer demand as a result of market fluctuations and global economic uncertainty. In 2026, Embedded Antenna expects to see a slow recovery in demand for its products, particularly as more service providers shift from Wi-Fi 6 to Wi-Fi 7. For now, we anticipate Embedded Antenna will perform at reasonable levels in the first quarter of 2026, but full-year revenue of 2026 is expected to be stronger than 2025. The number of active bids for new projects remains at a solid level.
Satcom Business Line
Satcom had a challenging year in 2025, with lower revenue, gross profit and Adjusted EBITDA compared to 2024. In large part, this was due to reduced demand for its products, particularly its specialized custom engineered products, such as high power amplifiers for use in military, government, and broadcast applications. The backlog is still low for now, although opportunities for new projects remain strong. Overall, we do not expect a recovery in 2026, with financial metrics lower than those in 2025. Management has taken significant steps to align Satcom’s cost structure with its reduced production volume and order flow.
Satcom is generally not subject to US tariffs. See “Tariffs” below.
Tariffs
The Company continues to take proactive steps to monitor and mitigate the effect of US tariffs across all its business lines.
Wireless Infrastructure’s products are manufactured in our facility in China or third-party facilities in Vietnam. The actual gross margin impact of tariffs on this business line has been mitigated to a level much lower than the applicable tariff due to a number of measures taken by the Company. This has allowed Wireless Infrastructure to be compliant with the current tariff regime while maintaining a strong margin position.
Embedded Antenna is currently not directly affected by US tariffs on China. Although Embedded Antenna’s products are manufactured in our facility in China, they are shipped from there to contract manufacturers elsewhere in Asia for embedding in the final products of those contract manufacturers.
In the case of Satcom, most of its products are produced in Canada, of which a significant proportion – between 40% and 50% annually – is delivered to customers in the US. Satcom’s products are compliant with Canada’s free trade agreement with the United States and Mexico and, therefore, are not subject to the tariffs otherwise applicable on Canadian goods.
FISCAL YEAR DISCUSSION OF CONTINUING OPERATIONS
 Note: The financial information in the above table reflects results from continuing operations only.
- Factors affecting Revenue and Gross Profit
The Company’s revenue is derived from the sale of wireless and satellite communications components. Financial results are reported as one reportable segment.
The Company manufactures and sells a variety of components, including antenna products, such as antennas for networking and telemetry devices, land mobile radios, telematics and wireless infrastructure antennas, and satellite radio frequency and microwave products, such as amplifiers, converters, filters and transceivers. The Company’s revenue is impacted by the timing of customers’ product launches, their project deployment plans, and network expansion investment levels by telecom carriers and independent providers.
The Company’s gross profit is impacted by selling prices, sales volumes, product mix and variable costs of goods sold (being direct materials and direct labour). - Fiscal 2025 compared to Fiscal 2024
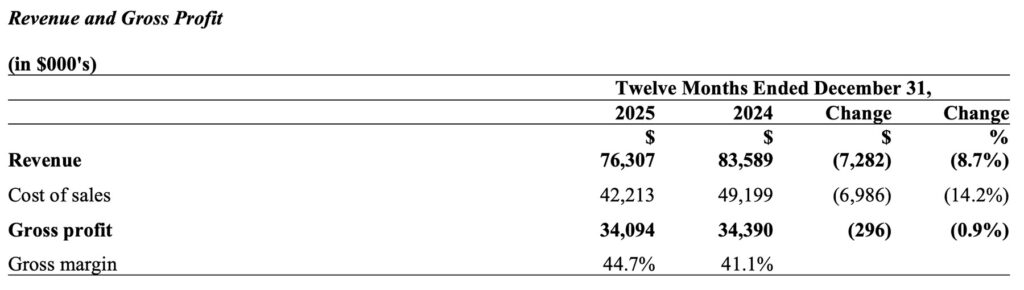
The Company’s revenue was $76.3 million in fiscal 2025 compared to $83.6 million in fiscal 2024, a decrease of $7.3 million or 8.7%. The decrease was primarily due to sales volume decrease in the Embedded Antenna and Satcom business lines in fiscal 2025, partially offset by an increase in the Wireless Infrastructure business line compared to the prior fiscal year.
The Company’s gross profit was $34.1 million in fiscal 2025 compared to $34.4 million in fiscal 2024. Gross margin was 44.7% in fiscal 2025 compared to 41.1% in fiscal 2024. The higher gross margin in fiscal 2025 was primarily due to more favourable product mix. Compared to the prior fiscal year, Wireless Infrastructure revenue as a percentage of total revenue was higher in fiscal 2025, and most of its products generate higher gross margins than the other two business lines.
Note: The financial information in the above table reflects results from continuing operations only.
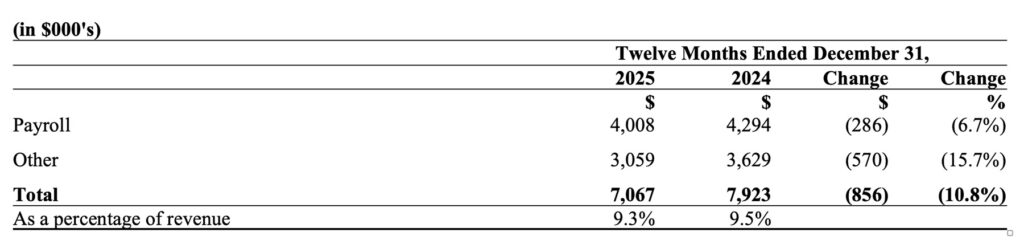
- Factors affecting Selling and Marketing Expenses
The Company’s selling and marketing expenses consist primarily of salaries, advertising, trade shows, travel costs and other promotional activities. These costs can be material when the Company enters new markets and acquires new customers, requiring meaningful investments to win new business. - Fiscal 2025 compared to Fiscal 2024
The Company’s selling and marketing expenses in fiscal 2025 were $7.1 million (9.3% of revenue) compared to $7.9 million (9.5% of revenue) in fiscal 2024. The decrease was primarily due to lower commissions and bonus accrual in fiscal 2025 as a result of the decrease in revenue compared to the prior fiscal year.
Research and Development Expenses
 Note: The financial information in the above table reflects results from continuing operations only.
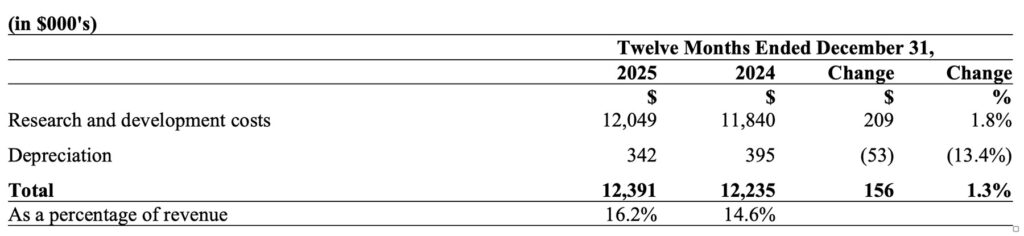
- Factors affecting Research and Development Expenses
The Company’s research and development (“R&D”) expenses consist primarily of salaries, patent fees, product development costs and other engineering expenses. Our technological design centres are located in the United States and Canada. The Company often incurs significant expenditures in the development of a new product without any assurance that its customers’ system designers will ultimately select the product for use in their applications. Management is often required to anticipate which product designs will generate demand in advance of its customers expressly indicating their need for that particular design. Even if the customers’ system designers ultimately select our products, a substantial period of time may elapse before the Company generates revenue relative to the possibly significant expenses it has initially incurred. - Fiscal 2025 compared to Fiscal 2024
The Company’s R&D expenses in fiscal 2025 were $12.4 million (16.2% of revenue) compared to $12.2 million (14.6% of revenue) in fiscal 2024. The increase was mainly due to higher payroll and engineering costs incurred for new products development in fiscal 2025 compared to the prior fiscal year.
General and Administrative Expenses
Note: The financial information in the above table reflects results from continuing operations only.
- Factors affecting General and Administrative Expenses
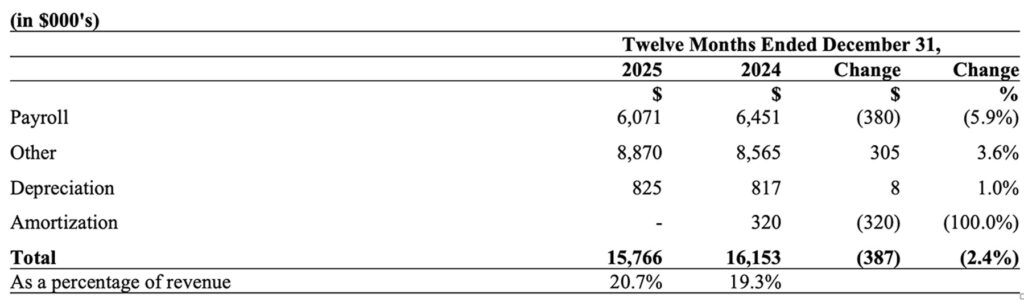
The Company’s general and administrative (“G&A”) expenses consist of costs relating to human resources, legal and finance, professional fees, insurance and other corporate expenses, as well as depreciation and amortization of G&A non-current assets. - Fiscal 2025 compared to Fiscal 2024
The Company’s G&A expenses in fiscal 2025 were $15.8 million (20.7% of revenue) compared to $16.2 million (19.3% of revenue) in fiscal 2024. The decrease was due partially to lower payroll costs in fiscal 2025 as a result of a lower number of administrative employees compared to the prior fiscal year. The decrease was also due to a discontinuance of amortization in fiscal 2025 as a result of an impairment charge to the remaining intangible assets of the Satcom business line in the fourth quarter of 2024.
Operating Loss and Net Loss
Note: The financial information in the above table reflects results from continuing operations only.
- Factors affecting Operating Loss and Net Loss
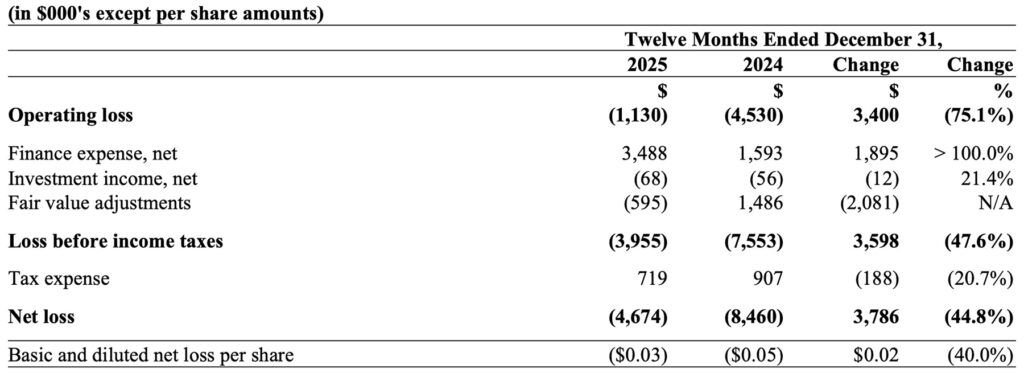
The Company’s operating loss and net loss are impacted by sales volumes, product sales mix, gross profit as well as operating expenses including the expenditures in R&D related to new products. - Fiscal 2025 compared to Fiscal 2024
The Company’s operating loss in fiscal 2025 was $1.1 million compared to $4.5 million in fiscal 2024. The improvement was mainly driven by higher gross margins and lower operating expenses in fiscal 2025 compared to the prior fiscal year. The operating loss in fiscal 2024 included an impairment charge to intangible assets in the amount of $2.6 million for the Satcom business line.
The Company’s net loss in fiscal 2025 was $4.7 million compared to $8.5 million in fiscal 2024. The net loss in fiscal 2025 was primarily due to the operating loss of $1.1 million, along with interest expenses and other finance expenses including foreign exchange losses and fair value adjustment gains. Tax expense in fiscal 2025 comprises withholding taxes and income tax provision for the Company’s subsidiary in China. On a per share basis, fiscal 2025 generated a net loss of $0.03 per share compared to a net loss of $0.05 per share in fiscal 2024.
EBITDA and Adjusted EBITDA
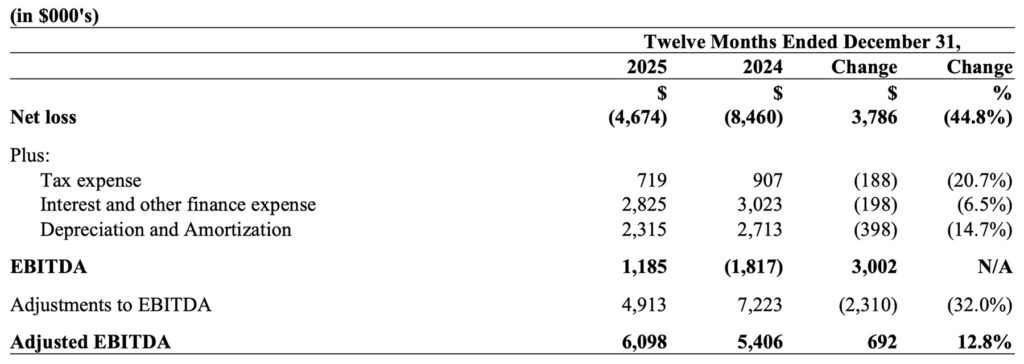
EBITDA and Adjusted EBITDA are non-IFRS measures that management uses to assess the Company’s operating performance (see “Non-IFRS Measures” on page 3 of this MD&A). EBITDA and Adjusted EBITDA are reconciled as follows:
Note: The financial information in the above table reflects results from continuing operations only.
- Factors affecting EBITDA and Adjusted EBITDA
The Company’s EBITDA is impacted by the factors discussed above for operating loss.
The Company’s Adjusted EBITDA is impacted by certain factors, including asset impairment charges, expenses related to mergers and acquisitions, gain or loss on the sale of a business line, including its related expenses, costs of reorganization of a business line, legal costs arising from significant non-operating activities, severance and executive recruitment costs, and share-based compensation. - Fiscal 2025 compared to Fiscal 2024
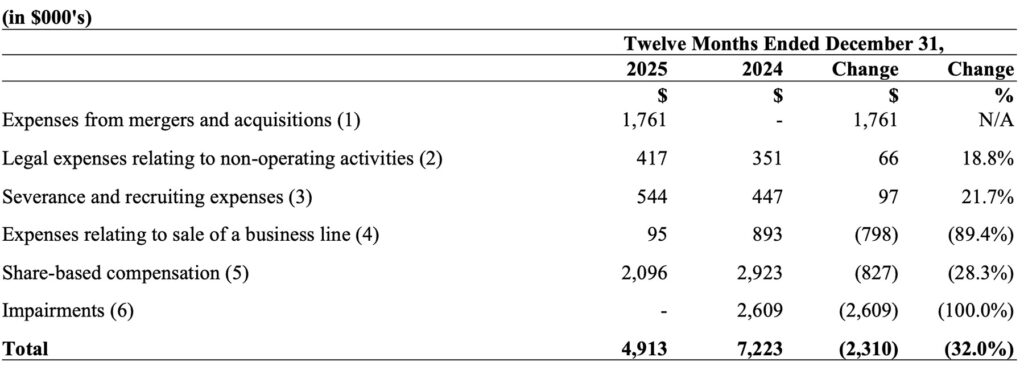
The Company’s EBITDA in fiscal 2025 was $1.2 million compared to -$1.8 million in fiscal 2024, and the Adjusted EBITDA in fiscal 2025 was $6.1 million compared to $5.4 million in fiscal 2024. Adjustments to EBITDA amounting to $4.9 million in fiscal 2025 and $7.2 million in fiscal 2024 are detailed in the table below.
Adjustments to EBITDA
Note: The financial information in the above table reflects results from continuing operations only.
The Company’s Adjusted EBITDA for the above periods was impacted by the following factors:
- Represents all third-party expenses associated with the Company’s acquisition of Kaelus.
- Represents legal costs incurred from significant non-operating activities, principally those related to litigation arising out of the Company’s acquisition of Advantech Wireless in 2018.
- Represents expenses incurred by the Company to recruit for vacancies in key management positions and severance costs of laid-off or terminated employees.
- Represents costs relating to the reorganization and sale of the M&N business line, including professional advisory fees such as investment banking and legal fees.
- Represents share-based compensation expenses related to grant of awards under the Company’s Omnibus Equity Incentive Plan.
- Represents impairment charges as a result of the impairment test analysis performed by the Company on its non-financial assets.
SUMMARY OF QUARTERLY RESULTS
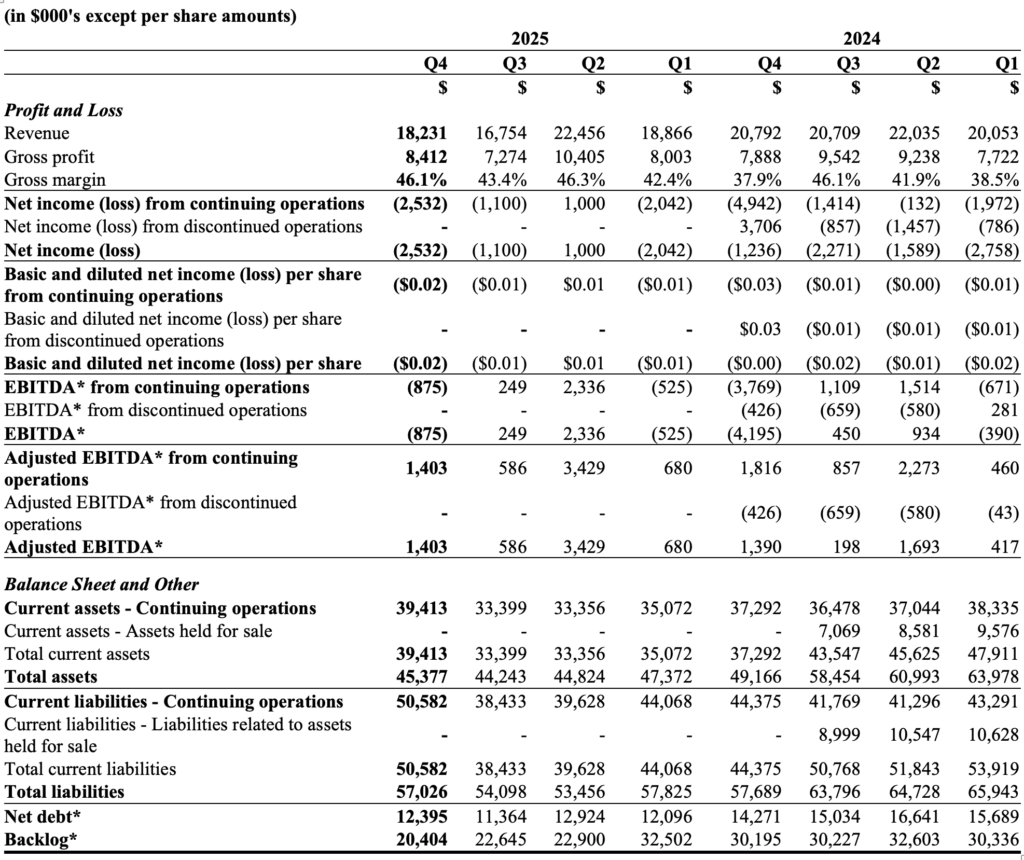
* EBITDA, Adjusted EBITDA, Net debt and Backlog are non-IFRS measures that management uses to assess the Company’s operating performance, liquidity and business dynamics (see “Non-IFRS Measures” on page 3 of this MD&A).
The Company has achieved eight consecutive quarters of positive Adjusted EBITDA as at the end of fiscal 2025, and the Company’s net debt has been well controlled throughout fiscal 2025 with the quarterly levels consistently lower than the prior year periods.
FOURTH QUARTER DISCUSSION OF CONTINUING OPERATIONS
Revenue and Gross Profit
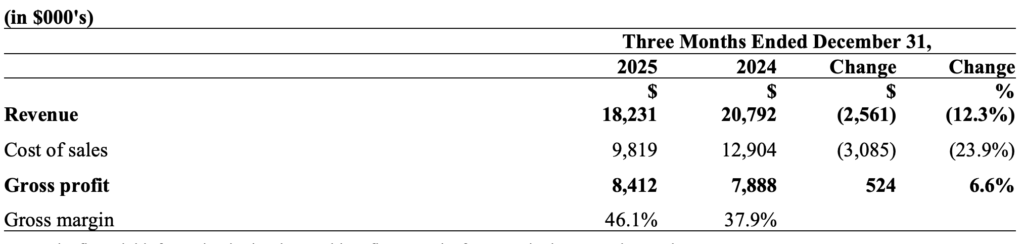
- Fourth Quarter of 2025 compared to Fourth Quarter of 2024
The Company’s revenue was $18.2 million in the fourth quarter of 2025 compared to $20.8 million in the fourth quarter of 2024, a decrease of $2.6 million or 12.3%. The decrease was mainly due to sales volume decrease in the Embedded Antenna and Satcom business lines compared to the prior year period.
Despite the decrease in revenue, gross profit was $8.4 million in the fourth quarter of 2025, an increase of $0.5 million or 6.6% compared to the fourth quarter of 2024. Gross margin was 46.1% in the fourth quarter of 2025 compared to 37.9% in the fourth quarter of 2024. The increase in gross profit and the higher gross margin was mainly due to the Wireless Infrastructure business line which generated stronger revenue and favourable product mix coupled with improvements in gross margin in the Embedded Antenna business line.Selling and Marketing Expenses
Selling and Marketing Expenses
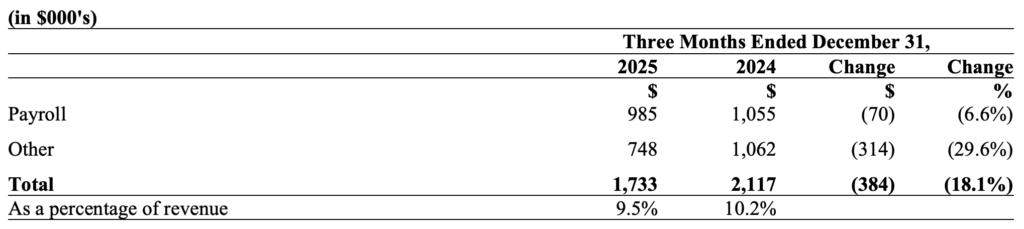
Note: The financial information in the above table reflects results from continuing operations only.
- Fourth Quarter of 2025 compared to Fourth Quarter of 2024
The Company’s selling and marketing expenses in the fourth quarter of 2025 were $1.7 million (9.5% of revenue) compared to $2.1 million (10.2% of revenue) in the fourth quarter of 2024. The decrease was primarily due to lower commissions and bonus accrual as a result of the decrease in revenue compared to the prior year period.
Research and Development Expenses
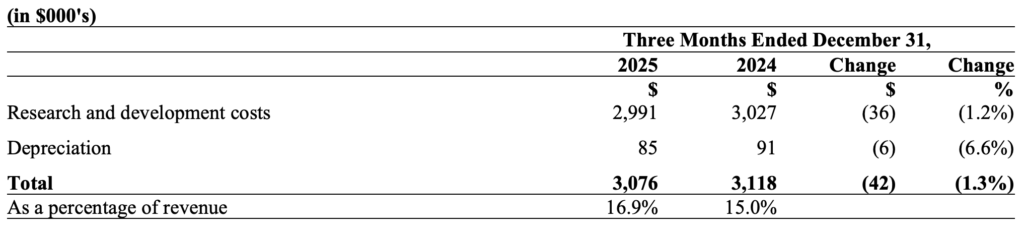
Note: The financial information in the above table reflects results from continuing operations only.
- Fourth Quarter of 2025 compared to Fourth Quarter of 2024
The Company’s R&D expenses in the fourth quarter of 2025 were $3.1 million (16.9% of revenue), which were largely consistent with the fourth quarter of 2024.
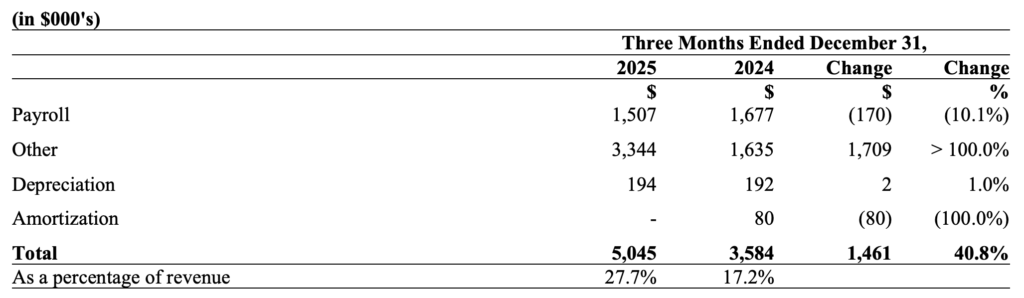
General and Administrative Expenses
Note: The financial information in the above table reflects results from continuing operations only.
- Fourth Quarter of 2025 compared to Fourth Quarter of 2024
The Company’s G&A expenses in the fourth quarter of 2025 were $5.0 million (27.7% of revenue) compared to $3.6 million (17.2% of revenue) in the fourth quarter of 2024. The increase primarily resulted from higher Other expenses in the fourth quarter of 2025, during which the Company recorded multiple accruals and expenses in the total amount of $1.8 million for the legal and professional expenses associated with the acquisition of Kaelus.
Operating Loss and Net Loss
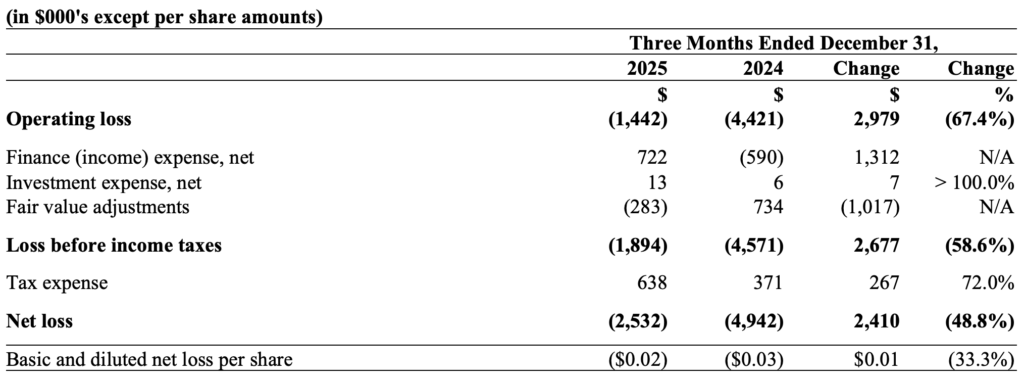
Note: The financial information in the above table reflects results from continuing operations only.
- Fourth Quarter of 2025 compared to Fourth Quarter of 2024
The Company’s operating loss in the fourth quarter of 2025 was $1.4 million compared to $4.4 million in the fourth quarter of 2024. The operating loss in the fourth quarter of 2025 included $1.8 million accruals and expenses associated with the acquisition of Kaelus. The operating loss in the fourth quarter of 2024 included $2.6 million impairment charge and $0.9 million reclassification of gain on sale of GTK.
The Company’s net loss in the fourth quarter of 2025 was $2.5 million compared to $4.9 million in the fourth quarter of 2024. The net loss in the fourth quarter of 2025 was primarily due to the operating loss of $1.4 million, interest and other finance expenses, as well as tax expenses. The net loss in the fourth quarter of 2024 was mainly due to the operating loss of $4.4 million discussed above. On a per share basis, the fourth quarter of 2025 produced a net loss of $0.02 per share compared to a net loss of $0.03 per share in the fourth quarter of 2024.
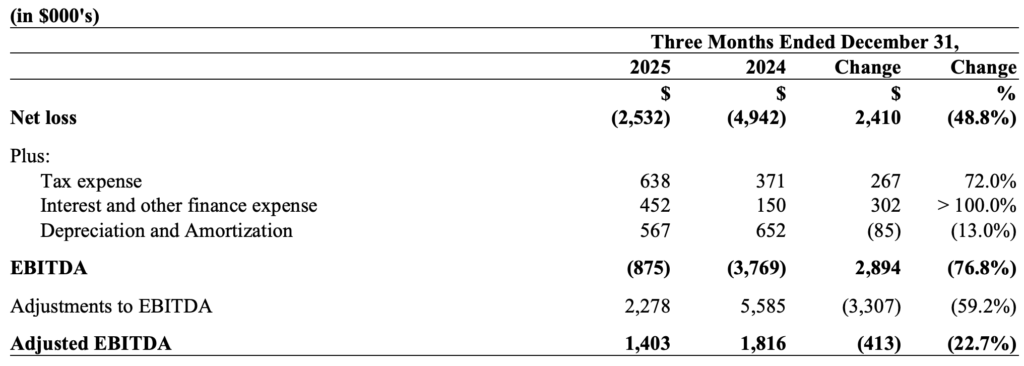
EBITDA and Adjusted EBITDA
EBITDA and Adjusted EBITDA are reconciled as follows:
| Reconciliation from Net Loss to EBITDA and Adjusted EBITDA |
Note: The financial information in the above table reflects results from continuing operations only.
- Fourth Quarter of 2025 compared to Fourth Quarter of 2024The Company’s EBITDA in the fourth quarter of 2025 was -$0.9 million compared to -$3.8 million in the fourth quarter of 2024, and the Adjusted EBITDA in the fourth quarter of 2025 was $1.4 million compared to $1.8 million in the fourth quarter of 2024. Adjustments to EBITDA amounting to $2.3 million in the fourth quarter of 2025 and $5.6 million in the fourth quarter of 2024 are detailed in the table below.
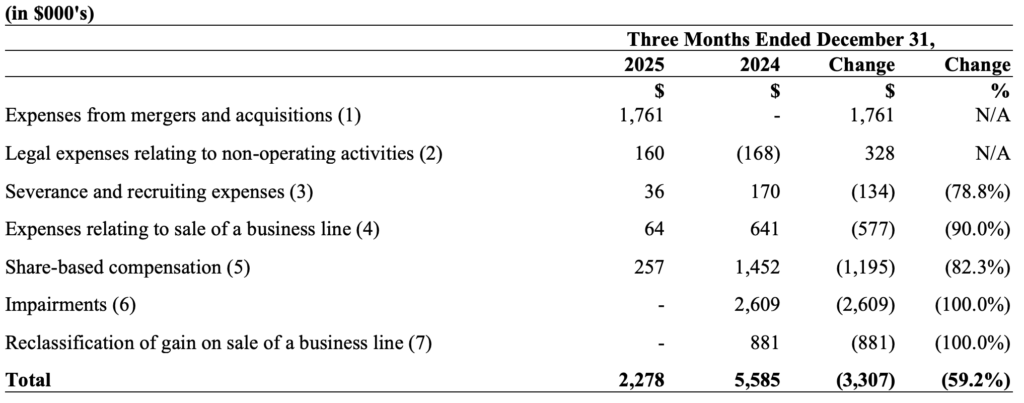
Adjustments to EBITDA
Note: The financial information in the above table reflects results from continuing operations only.
The Company’s Adjusted EBITDA for the above periods was impacted by the following factors:
- Represents all third-party expenses associated with the Company’s acquisition of Kaelus.
- Represents legal costs incurred from significant non-operating activities, primarily those related to litigation arising out of the Company’s acquisition of Advantech Wireless in 2018.
- Represents expenses incurred by the Company to recruit for vacancies in key management positions and severance costs of laid-off or terminated employees.
- Represents costs relating to the reorganization and sale of the M&N business line, including professional advisory fees such as investment banking and legal fees.
- Represents share-based compensation expenses related to grant of awards under the Company’s Omnibus Equity Incentive Plan.
- Represents impairment charges as a result of the impairment test analysis performed by the Company on its non-financial assets.
- Represents the reclassification of gain on sale of GTK to the discontinued operations in the fourth quarter of 2024, which was previously included as an adjustment to EBITDA in the third quarter of 2024.
CASH FLOWS
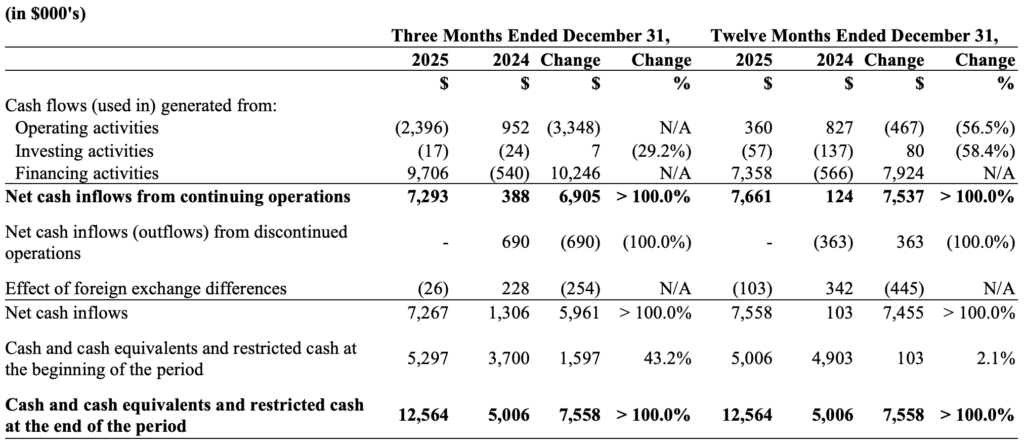
Note: The financial information in the above table reflects results from continuing operations only.
Operating Activities
In the fourth quarter of 2025, $2.4 million was used in operating activities compared to $1.0 million generated in the fourth quarter of 2024. The higher cash outflows from operating activities in the fourth quarter of 2025 was primarily impacted by lower revenue and an increase in working capital.
In fiscal 2025, $0.4 million was generated from operating activities compared to $0.8 million in fiscal 2024. The Company had a moderate decrease of cash inflows from operating activities in fiscal 2025 despite larger decrease in revenue, mainly due to a combination of disciplined cost management, less interest paid as a result of lower debt, as well as efficient working capital movements compared to the prior fiscal year.
Investing Activities
In both the fourth quarter of 2025 and the fourth quarter of 2024, only minimal cash was used in investing activities, and approximately $0.1 million was used in both fiscal 2025 and fiscal 2024. The minimal cash used in investing activities was primarily due to cash conservation measures to preserve liquidity, resulting in the Company’s capital expenditures at a consistently low level.
Financing Activities
In the fourth quarter of 2025, $9.7 million was generated from financing activities compared to $0.5 million used in the fourth quarter of 2024. In December 2025, the Company completed an issuance of subscription receipts for net proceeds of $9.9 million. The proceeds are intended to be used to finance a portion of purchase price for the acquisition of Kaelus and are being held in escrow, conditional on the completion of the acquisition, failing which they will be returned to investors.
In fiscal 2025, $7.4 million was generated from financing activities compared to $0.6 million used in fiscal 2024. The cash inflows from financing activities in fiscal 2025 was mainly due to the proceeds from the issuance of subscription receipts as mentioned above and the proceeds of $2.25 million from issuance of preferred shares in the third quarter of 2025, partially offset by cash used to pay down the Company’s revolving credit facility during fiscal 2025.
NET DEBT, CAPITAL RESOURCES AND LIQUIDITY
The Company’s capital resources are in part used to fund working capital (see “Non-IFRS Measures” on page 3 of this MD&A) associated with product launches, to invest in design proposals for customers, and for capital investments required to sustain and expand business and manufacturing capabilities in order to meet customer demands.
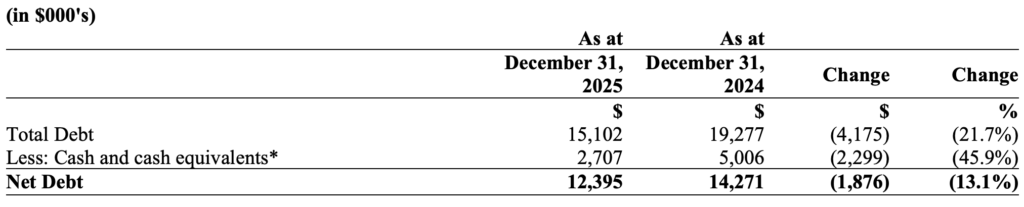
* Cash and cash equivalents do not include the restricted cash of $9.9 million which was the net proceeds of the issuance of subscription receipts in December 2025.
The Company had net debt at December 31, 2025 and December 31, 2024 of $12.4 million and $14.3 million, respectively. The decrease in net debt was mainly due to lower lease and interest payments and efficient management of working capital during fiscal 2025.
Liquidity
Management’s approach is to ensure, to the extent reasonably possible, that sufficient liquidity exists to meet liabilities as they become due. We do so by monitoring cash flows, revenue and expenses compared to their budgeted amounts. Cash flow is reviewed with each business line management team on a weekly basis while other metrics such as cash conversion cycle (“CCC”, see “Non-IFRS Measures” on page 3 of this MD&A) are reviewed with each business line management team on a monthly basis. Management looks to these key indicators to ensure the Company is generating sufficient cash to maintain sufficient liquidity and meet planned growth. For example, a low CCC implies a more efficient use of working capital.
Liquidity is impacted by the availability and maturity of the Company’s revolving credit facility (see “Credit from banks and loans” on page 19 of this MD&A).
Working capital requirements
Working capital requirements are primarily for raw materials, production, sales and marketing, R&D, operations and G&A expenses. Working capital requirements could see an increase due to increased sales volumes, increased inventory levels to meet additional demand, customer payment delay, and/or paying suppliers more quickly. These changes increase the CCC, which in turn reduces the overall liquidity in the business. As at December 31, 2025, the Company’s CCC was 58 days compared to 57 days as at December 31, 2024, which remained largely consistent.
During the twelve months ended December 31, 2025, the Company’s working capital had minimal changes, which mainly resulted from the following factors:
- Decrease in trade receivables of $2.9 million, mainly due to a decrease in revenue in the Satcom and Embedded Antenna business lines in the fourth quarter of 2025 compared to the fourth quarter of 2024;
- Decrease in inventories of $2.1 million, primarily due to a decrease in Satcom inventories in the latter part of 2025 impacted by lower raw materials purchases compared to the latter part of 2024;
offset by: - Decrease in trade payables and other current liabilities of $5.6 million, mainly due to settlement of a court order in the third quarter of 2025 by paying $1.8 million along with accrued interest owed to the escrow agent appointed in connection with the Company’s acquisition of Advantech Wireless in 2018 as well as lower volume related trade payables reductions.
Commitment for capital expenditures
As at December 31, 2025, the Company had an aggregate commitment for capital expenditures of approximately $0.1 million, which are primarily for upgrades to the IT system and hardware maintenance.
Credit from banks and loans
On May 29, 2025, the Company entered into an Amended and Restated Credit Agreement (the “Credit Agreement”) with Royal Bank of Canada, which continued the Company’s existing $15 million revolving credit facility (the “Revolving Facility”). The Credit Agreement amended and restated the original credit agreement dated March 29, 2019.
The Revolving Facility is guaranteed by the Company’s subsidiaries and is secured by substantially all the assets of the Company and the guarantors (subject to existing security of the Company’s Chinese subsidiary). The Credit Agreement also includes other customary positive and negative covenants (including limitations on changes to business, additional debt, dispositions, investments, distributions, capital expenditures and financial assistance), and customary events of default for a facility of this type.
The availability of the Revolving Facility is based on the Company’s trade receivables and inventory balances. The interest rate on the Revolving Facility is determined based on the type of advance, the applicable margin and the Company’s Senior Debt to EBITDA Ratio (as defined in the Credit Agreement). Interest is payable monthly in arrears. The Revolving Facility is available in both US dollars and Canadian dollars. As at December 31, 2025, the interest rate applied to the Revolving Facility was 9.75% per annum on US dollar advances and 6.95% per annum on Canadian dollar advances (both rates include the applicable margin of 2.50%).
The Company may draw on the Revolving Facility as well as revolving credit facilities with a bank domiciled in China, as needed. As at December 31, 2025, the Company’s aggregate revolving credit facilities were $20.9 million, of which $14.7 million was drawn and utilized, including $9.9 million under the Revolving Facility.
The Credit Agreement has been amended as of January 28, 2026. The effect of the amendments is that:
- the maturity date of the Revolving Facility has been extended to April 30, 2026;
- the Company is required to maintain a Senior Debt to EBITDA Ratio of not greater than 2.75:1.00 and a Fixed Charge Coverage Ratio (as defined in the Credit Agreement) of greater than 1.15:1.00 to be calculated monthly until maturity of the Revolving Facility;
- the minimum Liquidity and minimum EBITDA covenants will not be applicable for testing during the remaining period of the Revolving Facility;
- the maximum availability under the Revolving Facility is $15 million; and,
- at any time the Senior Debt to EBITDA Ratio is equal to or more than 2.75:1.00, the margin on advances under the Revolving Facility is 2.50% and the standby fee is 0.70%.
Convertible debentures
On July 10, 2018, the Company issued $17.25 million principal amount of convertible unsecured debentures (the “Debentures”). The Debentures are governed by an indenture (the “Indenture”) dated July 10, 2018 between the Company and Computershare Trust Company of Canada, as trustee. The Debentures originally had an interest rate of 6.5% per annum, payable semi-annually in arrears on June 30 and December 31 of each year, matured on July 10, 2023 and had a conversion price (the “Conversion Price”) of $3.85 per common share.
On May 19, 2021, the Indenture was amended to reduce, for a period of 30 days, the Conversion Price from $3.85 to $1.11 (the “New Conversion Price”), the market price of the common shares at the time the amendment became effective. As a result of this amendment, holders of $12.135 million principal amount of the Debentures converted their Debentures into 10,932,429 common shares at the New Conversion Price, leaving $5.115 million principal amount of the Debentures outstanding. The 30-day period during which the New Conversion Price remained in effect ended on June 18, 2021, following which the Conversion Price reverted to $3.85.
On June 21, 2023, the Indenture was further amended to (i) extend the maturity date of the Debentures from July 10, 2023 to June 30, 2026 (the “Maturity Date”), (ii) increase the interest rate on the Debentures from 6.5% to 8.5%, effective June 30, 2023, (iii) reduce the Conversion Price from $3.85 to $1.00 per common share, and (iv) change the definition of “Change of Control” to permit the Company’s Chairman, Jeffrey C. Royer, and related parties, to acquire 66 2/3% or more of the common shares of the Company without it constituting a Change of Control. As a result of the Company’s December 2023 rights offering, the Conversion Price was adjusted and is now $0.9156 per common share.
The Debentures are convertible at the holder’s option into common shares of Baylin at any time prior to the close of business on the earlier of: (i) the last business day before the Maturity Date; or, (ii) if called for redemption, the business day immediately preceding the date specified by the Company for redemption, at a Conversion Price of $0.9156 per common share, subject to adjustment in accordance with the Indenture.
The Company may, at its option, subject to receipt of any required regulatory approvals, elect to satisfy its obligation to repay the principal amount of the Debentures at maturity, provided no Event of Default (as defined in the Indenture) has occurred and is continuing at such time, upon not more than 60 days’ and not less than 40 days’ prior written notice, by delivering that number of freely tradeable common shares obtained by dividing the principal amount of the Debentures being repaid by 95% of the Current Market Price (which will be calculated based on the 20 consecutive trading days ending five trading days before the Maturity Date). Current Market Price means the volume-weighted average trading price of the common shares on the Toronto Stock Exchange for the 20 consecutive trading days ending five trading days preceding the applicable date.
Upon a Change of Control of the Company, the Company may be required to repurchase the Debentures, at the option of the holder, in whole or in part, at a price equal to 101% of the principal amount of the Debentures outstanding, plus accrued interest.
The Debentures are classified as financial liabilities at fair value through profit or loss and are measured at fair value with changes recognized in the consolidated statement of net income (loss). Further details of the Debentures are set out in the Indenture filed under the Company’s profile on SEDAR+ at www.sedarplus.ca.
SHARE-BASED PAYMENTS
Omnibus Equity Incentive Plan
On August 13, 2020, the shareholders of the Company approved a new Omnibus Equity Incentive Plan (as amended and restated, the “Omnibus Plan”). The Omnibus Plan permits the board of directors to grant a wide range of long-term incentive awards to participants. The awards include deferred share units (“DSUs”), which are for directors only, performance share units (“PSUs”), restricted share units (“RSUs”), stock options and common shares (with or without restrictions). The Omnibus Plan replaced the separate Deferred Share Unit Plan (“DSU Plan”), Stock Option Plan and Employee Share Compensation Plan (“ESCP”). Awards granted after August 13, 2020 are governed by the Omnibus Plan. Awards granted before that date will continue to be governed by the plan under which they were granted. The number of common shares issuable under the Omnibus Plan, including the DSU Plan, Stock Option Plan and ESCP, may not exceed 12% of the number of common shares outstanding from time to time. However, the Omnibus Plan is an “evergreen plan”, meaning that any awards that are exercised or settled or terminated without being exercised or settled are available for subsequent grant and do not reduce the number of common shares available to be granted. There are also limitations on the number of common shares that may be issued to insiders.
The Company may settle DSUs, PSUs and RSUs in (i) common shares issued from treasury, (ii) common shares purchased in the market, (iii) cash or (iv) a combination of common shares and cash. Holders of stock options may exercise their options, (i) by paying the option exercise price or (ii) with the consent of the Company, through a cashless exercise or by receiving a cash payment in lieu of shares.
Unless otherwise approved by the board of directors, eligible directors must elect to receive at least 50% and up to 100% of their annual retainers in DSUs or common shares of Baylin. The DSUs and common shares are issued on a periodic basis while the director serves as a board member and vest immediately. The DSUs are settled after the member ceases to be a director.
The following table lists the number of DSUs outstanding as at December 31, 2025 and December 31, 2024:
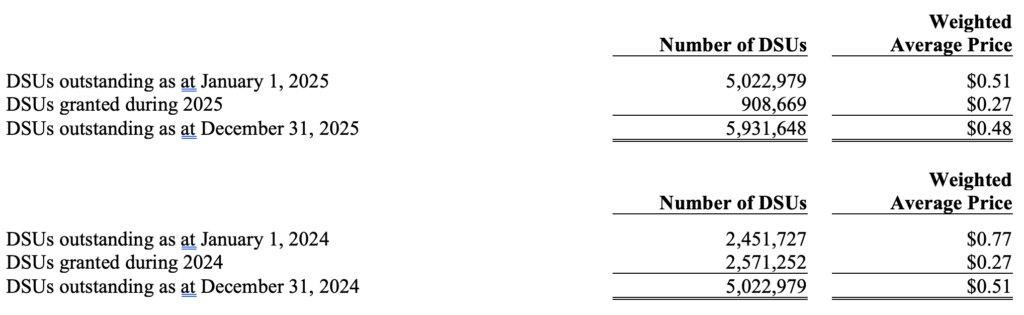
The Company recognized a DSU expense of $0.2 million during the twelve months ended December 31, 2025, which was included in G&A expenses.
Stock Option Grants
Stock options may be granted by the board of directors to officers, employees and consultants of the Company (or its subsidiaries or investee entities) as performance incentives. At the time of granting a stock option, the board of directors will determine: (i) the exercise price, being not less than the market value of the common shares; (ii) the vesting provisions, generally being three years, with an equal number of common shares vesting on each anniversary of the grant date, and (iii) the expiry date, generally being no more than five years after the grant date.
The table below summarizes stock option grants as at December 31, 2025:
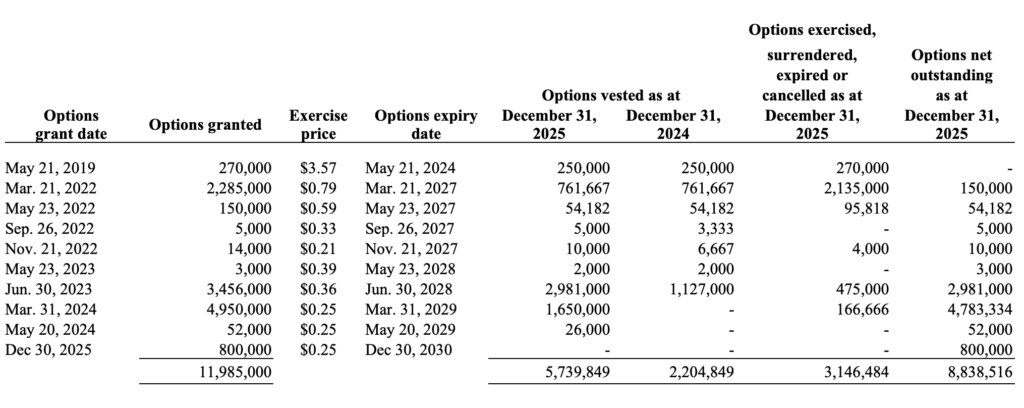
The Company recognized a stock option expense of $0.5 million during the twelve months ended December 31, 2025, which was included in G&A expenses. In March 2023, employees with outstanding out-of-the-money options were given the opportunity to have their options cancelled on a voluntary basis. As a result, effective March 29, 2023, 3,606,000 options were cancelled. Effective June 30, 2023, the board of directors approved a new grant of 3,456,000 options.
During the second quarter of 2023, 1,856,410 RSUs were issued with a value of $0.7 million.
2024 Bonus Awards Plan and Performance Award Plan
On May 8, 2025, the shareholders of the Company approved two new share compensation arrangements, a 2024 Bonus Awards Plan (the “Bonus Plan”) and a Performance Award Plan (the “Performance Plan”), which are both separate from the Omnibus Plan. The Bonus Plan permits the grant of RSUs or common shares to employees eligible to receive a bonus in respect of the Company’s 2024 fiscal year. The maximum number of common shares issuable under the Bonus Plan may not exceed 4,203,703 common shares. The Performance Plan is designed to incentivize the Company’s Chief Executive Officer to create and increase value for shareholders by achieving discretionary performance targets tied to the Company’s strategic and operating plans.
The Performance Plan permits the grant of PSUs, which are tied to the achievement of market and non-market performance goals over a specified period. The PSUs subject to non-market performance conditions were measured at their grant date fair value, based on the closing share price on June 30, 2025. Non-market performance conditions are not reflected in the grant date fair value; instead, compensation expense is recognized over the vesting period based on the number of units expected to vest, with estimates revised at each reporting date. Once a performance goal has been achieved, the board of directors of the Company will determine, based on the relative significance of the performance goal and its benefit to the Company, the number of PSUs that will vest with respect to that performance goal, subject to a minimum grant of 500,000. The maximum number of common shares issuable under the Performance Plan may not exceed 2,500,000 common shares.
During the second quarter of 2025, 3,260,458 RSUs (with an issue value of $0.8 million) and 834,916 common shares (with an issue value of $0.2 million) were granted under the Bonus Plan (of which 8,222 have been cancelled) and 2,500,000 PSUs (with an issue value of $135,000 of which $90,000 vested during the twelve months ended December 31, 2025) were granted under the Performance Plan. Of the outstanding RSUs, 989,727 will vest on May 15, 2026, one year from the date of grant, and 2,262,509 will vest on September 30, 2026. The common shares were not subject to a vesting condition.
CONTRACTUAL OBLIGATIONS AND OFF-BALANCE SHEET ARRANGEMENTS
The following table summarizes our significant contractual obligations and other obligations as well as our off-balance sheet arrangements as at December 31, 2025:
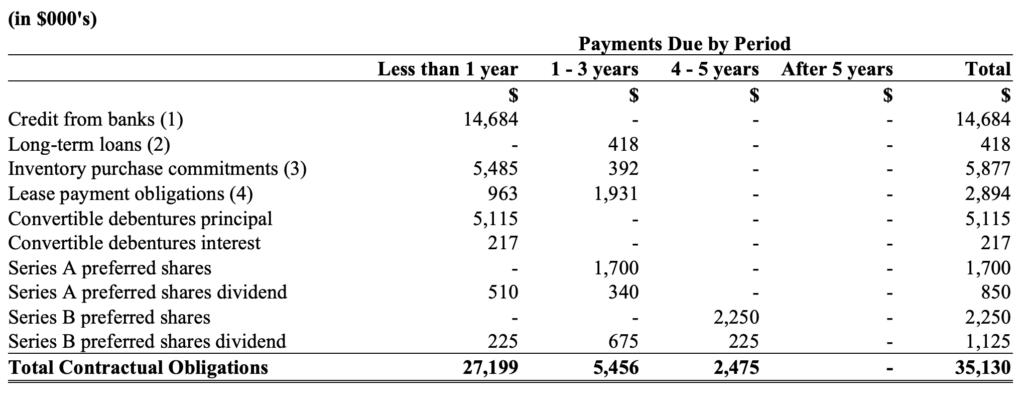
Notes:
- Represents the amount due on maturity of the Company’s Revolving Facility as well as revolving credit facilities with a bank domiciled in China. For further details, see Note 15 to our Consolidated Financial Statements for the year ended December 31, 2025.
- Represents the amount due on maturity of a sale and leaseback facility between the Company’s Chinese subsidiary and a financial lease company domiciled in China. For further details, see Note 15 to our Consolidated Financial Statements for the year ended December 31, 2025.
- Represents the cost (excluding duties and shipping) of outstanding inventory purchases ordered from our suppliers and expected to be received within the period.
- Represents the Company’s payment obligations related to financial lease liabilities. For further details, see Note 11 to our Consolidated Financial Statements for the year ended December 31, 2025.
TRANSACTIONS WITH RELATED PARTIES
Executive officer remuneration
Short-term benefits, pension and post-retirement benefits of the Company’s executive officers amounted to $5.0 million for fiscal 2025 compared to $5.4 million for fiscal 2024. These amounts comprise of executive officers’ salary and benefits earned during the year, plus bonuses awarded for the year. These amounts also represent the estimated costs of providing defined benefit pensions and other post-retirement benefits to executive officers in respect of the service for the year.
Other
The Company retains the services of Mr. Jeffrey C. Royer, pursuant to a services agreement between Mr. Royer and the Company dated as of January 1, 2015, to fulfill the position of Chairman of the board of directors and to provide related strategic leadership and guidance to the board of directors and management of the Company. As Chairman of the board of directors, Mr. Royer is entitled to an annual fee of $125,000. Mr. Royer has waived the payment of this fee for 2025 and 2024.
SIGNIFICANT ACCOUNTING JUDGEMENTS, ESTIMATES AND ASSUMPTIONS
The preparation of the consolidated financial statements requires the Company’s management to make judgements, estimates and assumptions that have an effect on the application of the accounting policies and on the reported amounts of assets, liabilities, revenues and expenses. Changes in accounting estimates are reported in the period of the change in estimate.
The key assumptions made in the financial statements concerning uncertainties at the end of the reporting period and the critical estimates and judgements made by the Company that may result in a material adjustment to the carrying amounts of assets and liabilities within the next fiscal year are discussed below.
Operating segments
The Company is considered to operate as one segment. In making this judgement, the Company has evaluated the business activities from which it earns revenues and incurs expenses, at which level operating results are reviewed by the chief operating decision maker and for which discrete financial information is available. The Chief Executive Officer of the Company has been deemed the chief operating decision maker.
Impairment of non-financial assets
Impairment exists when the carrying amount of an asset exceeds its recoverable amount. In evaluating impairment, the Company determines recoverable amount based on value in use (“VIU”).
Estimates used in arriving at value in use involve significant judgement of changes in market and other conditions that can affect VIU. VIU includes adjustments for obsolescence, which are based in part on assumptions that are influenced by factors that are both internal and external to the Company, and therefore changes in such factors can affect those assumptions. Discounted future cash flows include a number of estimates and assumptions surrounding assumed growth rates, number of years in discounted future cash flow models and the discount rate.
Leases
The Company has applied judgement to determine the incremental borrowing rate and the lease term for some lease contracts in which it is a lessee that include renewal options, which significantly affects the amount of lease liability and right of use assets recognized. The Company has used the practical expedient of applying hindsight in assessing certain lease extension options. The Company has also used judgement in determining the incremental borrowing rate based on the term, security, the lessee’s economic environment, credit rating and level of indebtedness, and asset specific adjustments.
Revenue recognition
The Company applies judgement related to recognizing revenue related to bill-and-hold arrangements. Judgment is applied to determine when control has transferred to the customer and thus the related revenue can be recognized. To determine whether control has transferred, the Company assess whether it has the ability to direct the use of, and obtain substantially all of the remaining benefits from the asset being sold as well as prevent other entities from doing so.
Income taxes
The Company is subject to income taxes in all jurisdictions in which it operates. Significant judgement is required in determining the tax provision. There are many transactions and calculations for which the ultimate tax determination is uncertain. Where the final tax outcome of these matters is different from the amounts that were initially recorded, such differences will impact the current and deferred income tax assets and liabilities in the period in which such determination is made. Deferred tax assets are recognized for unutilized carry forward tax losses and deductible temporary differences to the extent that it is probable that taxable income will be available against which the losses can be utilized. Significant judgement is required to determine the amount of deferred tax assets that can be recognized, based upon the likely timing and level of future taxable profits together with future tax planning strategies.
Share-based payments
The Company generally utilizes the Black-Scholes option pricing model to determine the fair values of stock options and warrants. The Company uses significant judgement in the determination of the input variables in Black-Scholes calculation, which include: risk free interest rate, expected stock price volatility, expected life, and expected dividend yield.
The Company’s Performance Share Units (“PSUs”) vest upon the achievement of specified performance objectives as determined and approved by the board of directors. Management has exercised judgement in determining whether these objectives represent market or non-market performance conditions. This classification affects measurement of the grant-date fair value and the recognition of compensation expense.
For non-market performance conditions, management is required to assess at each reporting date whether the conditions are probable of being satisfied. Judgement was also applied in estimating the number of PSUs expected to vest.
Deferred tax assets and liabilities
The Company makes significant judgements in interpreting tax rules and regulations when calculating deferred tax assets and liabilities. Judgement is used to evaluate whether a deferred tax asset can be recovered based on our assessment of existing tax laws, estimates of future profitability, and tax planning strategies.
Provisions
The Company makes significant judgements when estimating a provision for impairment of inventories, incentives and credit losses. The level of the provision is assessed by taking into account relevant factors.
Going concern
The Company regularly reviews and makes an assessment of its ability to continue as a going concern. This assessment relies on significant judgements and assumptions, taking into account known future information, including whether events or conditions create material uncertainties that may cast significant doubt on the ability to continue as a going concern.
The Company is currently negotiating a new credit facility with lenders including alternative financing options. If it is not able to obtain financing, its financial position would be severely impacted, raising material uncertainty about its ability to continue as a going concern.
Based on the current assessment, the Company’s consolidated financial statements have been prepared on a going concern basis. However, the existence of the material uncertainty as disclosed above may cast significant doubt on the Company’s ability to continue as a going concern, and the consolidated financial statements do not include any adjustments that may be necessary if the Company were unable to continue in business and such adjustments could be material.
RISK MANAGEMENT AND FINANCIAL INSTRUMENTS
The business of the Company is subject to various financial risks such as interest rate risk, foreign exchange risk, credit risk, and liquidity risk. Our risk management plan focuses on activities that reduce to a minimum any possible adverse effects on our financial performance.
Interest rate risk
With respect to interest rate risk, the interest rate applied to the Revolving Facility is based on either US Base Rate or Canadian Prime Rate, which are both variable rates (see “Credit from banks and loans” on page 19 of this MD&A). As such, US Base Rate and Canadian Prime Rate are both sensitive to fluctuations in market interest rates, which are affected in turn by central bank policies aimed at controlling inflationary pressures within an economy. As interest rates rise, the Company’s cost of borrowing will increase, requiring it to fund the additional interest cost from its cash resources. The Company also has fair values risks related to exposure to changes in market interest rates on its Convertible Debentures.
Foreign exchange risk
With respect to foreign exchange risk, the Company utilized foreign exchange forward contracts in fiscal 2025 and 2024 to hedge net US dollar cash flows as a means to mitigate its foreign exchange risk. As at December 31, 2025, the Company did not have any remaining forward contracts in place.
Credit risk
The Company and its subsidiaries typically extend 30 to 90-day credit terms to their customers and regularly monitor the credit extended to such customers and their general financial condition but do not require collateral as security for these receivables. The Company provides an allowance for expected credit losses based on the factors that affect the credit risk of certain customers, past experience and other information. The Company also assesses expected credit losses based on its judgement of whether customers are able to pay or to pay on time in order to determine whether additional credit losses are expected. The Company mitigates the credit risk by purchasing credit insurance provided by Export Development Canada or Coface.
Liquidity risk
The Company monitors its liquidity risk through the use of quarterly budgets, weekly cash flow projections, and close monitoring of trade receivables balance, inventory build and payment to suppliers. The objective is to maintain sufficient liquidity in its operating entities through a combination of cash on hand, availability under the revolving credit facilities and working capital movements. The Company also regularly monitors the amounts owing to its Chinese subsidiary by other subsidiaries in order to ensure its compliance with China’s State of Administration of Foreign Exchange requirements.
Except as set forth in this MD&A and the notes to our audited consolidated financial statements, there were no additional risks identified during the twelve months ended December 31, 2025, and there were no changes to our use of financial instruments during the twelve months ended December 31, 2025.
OUTSTANDING SHARE DATA
As at the date of this MD&A, there were issued and outstanding:
- 152,795,816 common shares;
- 8,838,516 stock options;
- 1,856,410 RSUs; and,
- 5,931,648 DSUs.
Up to 16,626,574 common shares are issuable on exercise or settlement, as applicable, of the stock options, RSUs and DSUs, all of which were granted under the Omnibus Plan.
The number of common shares issuable under the Omnibus Plan may not exceed 12% of the number of common shares outstanding from time to time, being as at the date of this MD&A 18,335,497 common shares. As at the date of this MD&A, 1,708,923 common shares are available to be issued under the Omnibus Plan.
In addition, there are 3,252,236 RSUs outstanding under the 2024 Bonus Plan, each of which represents the right of holders to receive one common share on settlement, and 2,500,000 PSUs outstanding under the Performance Plan, each of which represents the right of the holder to receive one common share on settlement.
The Company also has outstanding 68,000 10% Cumulative Redeemable Retractable Series A Preferred Shares and 90,000 10% Cumulative Redeemable Retractable Series B Preferred Shares, all of which are held by the Company’s controlling shareholder, 2385796 Ontario Inc.
As at the date of this MD&A, there were also issued and outstanding $5.115 million principal amount of Debentures. The Debentures are convertible at the holder’s option into common shares at any time prior to the close of business on the earlier of: (i) the last business day before their maturity on June 30, 2026; or, (ii) if called for redemption, the business day immediately preceding the date specified by the Company for redemption, at a conversion price of $0.9156 per common share, subject to adjustment in certain events in accordance with the Indenture. If all the Debentures were converted at the current conversion price, it would result in the issuance of 5,586,500 common shares.
The Company may, at its option, subject to receipt of any required regulatory approvals, elect to satisfy its obligation to repay the principal amount of the Debentures at maturity, provided no Event of Default (as defined in the Indenture) has occurred and is continuing at such time, upon not more than 60 days’ and not less than 40 days’ prior written notice, by delivering that number of freely tradeable common shares obtained by dividing the principal amount of the Debentures being repaid by 95% of the Current Market Price. Current Market Price means the volume-weighted average trading price of the common shares on the Toronto Stock Exchange for the 20 consecutive trading days ending five trading days preceding the applicable date.
DISCLOSURE CONTROLS AND PROCEDURES AND INTERNAL CONTROL OVER FINANCIAL REPORTING
Management is responsible for the design and operating effectiveness of disclosure controls and procedures and internal control over financial reporting.
Disclosure controls and procedures are designed to provide reasonable assurance that information required to be disclosed by the Company in its annual filings, interim filings or other reports filed or submitted by it under securities legislation is recorded, processed, summarized and reported within the time periods specified in the securities legislation and include controls and procedures designed to ensure that information required to be disclosed in those filings and reports is accumulated and communicated to management (including the Chief Executive Officer and Chief Financial Officer, as appropriate) to allow timely decisions regarding required disclosure.
Internal control over financial reporting is designed to provide reasonable assurance regarding the reliability of the Company’s financial reporting and the preparation of its financial statements in accordance with IFRS.
There were no changes in our internal control over financial reporting during the twelve months ended December 31, 2025 that have materially affected, or are reasonable likely to materially affect, our internal control over financial reporting.
ADDITIONAL INFORMATION
Additional information relating to the Company, including the most recently filed Annual Information Form and Management Information Circular, is available under the Company’s profile on SEDAR+ at www.sedarplus.ca.
RISK FACTORS
For a detailed description of risk factors associated with the Company, please refer to the “Risk Factors” section of the Company’s Annual Information Form dated March 25, 2026, which is available under the Company’s profile on SEDAR+ at www.sedarplus.ca.
KAELUS – PROPOSED ACQUISITION
On December 1, 2025 the Company announced that it had entered into a definitive agreement to acquire 100% of the shares of Kaelus AB. The announcement contained forward looking financial information which has been updated as follows:
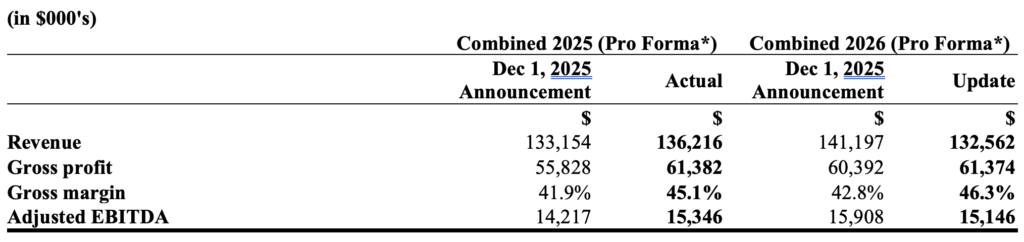
* Pro Forma refers to the assumption that the acquisition of Kaelus AB was completed on January 1, 2025 on the terms publicly described at the time of the announcement of the proposed acquisition.
Combined actual results on a pro forma basis for 2025 exceeded the forecast results announced on December 1, 2025, with higher revenue, gross profit, improved gross margin and stronger Adjusted EBITDA primarily as a result of the financial performance of the Wireless Infrastructure business line exceeding financial expectations for the fourth quarter of 2025.
Combined revenue on a pro forma basis for 2026 is expected to show a decline, mainly reflecting the anticipated impact of weakening customer order backlog and intake in the Satcom business line. Gross margin is expected to improve primarily due to a reclassification of amortized development costs from cost of sales to operating expenses, coupled with underlying gross margin improvements. Adjusted EBITDA is expected to decline to $15.1 million mainly due to the revenue decrease in the Satcom business line.
Reconciliations of the Company’s non-IFRS measures to their most comparable IFRS measures:
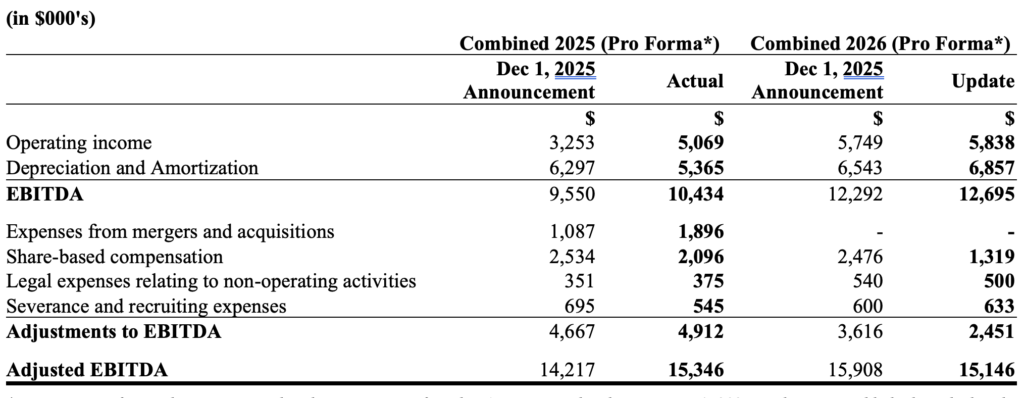
* Pro Forma refers to the assumption that the acquisition of Kaelus AB was completed on January 1, 2025 on the terms publicly described at the time of the announcement of the proposed acquisition.
Pro forma 2025 actual operating income was higher compared to the forecast in the December 1, 2025 announcement for the reasons mentioned above. Depreciation and Amortization was lower than anticipated due to shorter useful life estimates initially assumed by the management. Expenses from mergers and acquisitions were higher than anticipated due to higher professional services fees incurred associated with the acquisition of Kaelus, which were offset in part by lower share-based compensation costs.
Pro forma 2026 forecast EBITDA is expected to exceed the forecast with further improved gross margins in the Wireless Infrastructure and Embedded Antenna business lines. Share-based compensation is expected to be lower with a certain level of incentive payments planned to be cash based in 2026.
The financial outlook is based on a number of material factors and assumptions that reflect management’s assessment as of the date hereof, including assumptions that:
- Kaelus’s historical and forecast financial and operating information are accurate in all material respects;
- the Company will be able to integrate Kaelus without material disruption to the combined businesses;
- overall revenue growth is based on currently expected industry demand trends and customer order patterns within each business line;
- there will be no material change in macroeconomic, political or inflationary conditions generally, or in legal or regulatory markets in which the Company and Kaelus operate, that will materially impact the financial performance of the combined business;
- the respective businesses of the Company and Kaelus will not be affected materially by supply chain or other disruptions;
- there will be no material change in current foreign exchange rates, interest rates or accounting standards; and,
- Kaelus will be entitled under IFRS 38 to capitalize its development costs.
The financial outlook does not reflect potential operating synergies, cost savings or additional revenue from cross-selling opportunities and assumes capital expenditure levels and working capital investment consistent with management budgets for 2026.
The financial outlook is subject to significant risks and uncertainties that could cause actual results to differ materially, including the risk that our and Kaelus’s businesses may not perform as expected following the acquisition, that synergies and cross-selling opportunities may not materialize and the risks described under “Forward-Looking Information and Statements” in this MD&A and in the Company’s continuous disclosure documents available under its profile on SEDAR+. Readers are cautioned not to place undue reliance on the financial outlook. The financial outlook speaks only as at the date of this MD&A. Unless required by applicable law, the Company does not intend, and does not assume any obligation, to update the financial outlook.


